Sync monitoring
At a glance
Monitor the health of your syncs in real time from the Monitoring Hub. Quickly identify failures and review the full sync history.
Before you start
- At least one source configured and active (see Data Sources)
Access the Monitoring Hub
From the Live Data page, click the Monitoring button in the header. The direct URL is /livedata-hub.
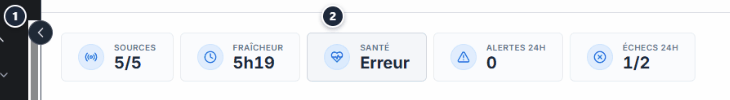
Key indicators (KPI)
The top of the page displays 5 indicators:
| Indicator | Description |
|---|---|
| Connected sources | Total number of active sources |
| Freshness | Average time since the last successful sync |
| Overall health | Percentage of sources with no errors |
| Failures 24h | Number of failed syncs in the last 24 hours |
| Syncs in progress | Number of syncs currently running |
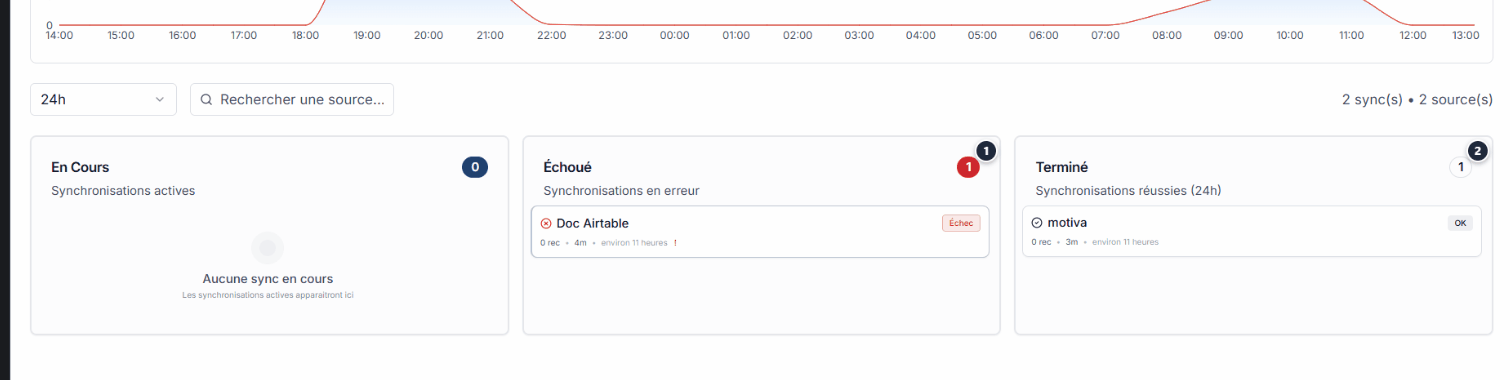
Sync Kanban
Below the KPIs, a Kanban board organizes syncs into 3 columns:
| Column | Content |
|---|---|
| In progress | Syncs currently running |
| Failed | Syncs in error (click to view details) |
| Completed | Successfully completed syncs |
Info
If no sync is in error, the Failed column is empty. This is normal behavior.
If no sync is in error, the Failed column is empty. This is normal behavior.
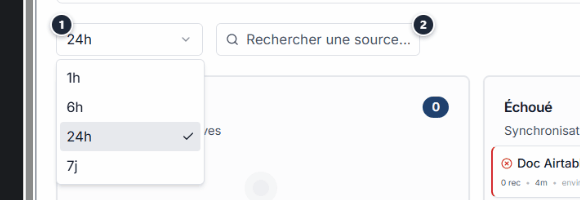
Filter syncs
Use the filters to refine the view:
| Filter | Options |
|---|---|
| Period | 1h, 6h, 24h, 7 days |
| Search | By source or connector name |
Expected outcome
Complete visibility
Full visibility into the health of your syncs. Failures are identified and problematic sources are easy to spot.
Full visibility into the health of your syncs. Failures are identified and problematic sources are easy to spot.
See also
- Data Sources -- Configure and manage your data sources.
- Troubleshooting -- Identify and fix connection errors.
- Connector catalogue -- Browse available connectors.
Need help?
Write to us: Support and contact.