Dashboard
Overview
The Dashboard provides a centralized view of your workspace activity. It gathers the key indicators from each module: Ontologie, Workflows, API Manager and Agent Hub.
Dashboard Sections
Ontologie
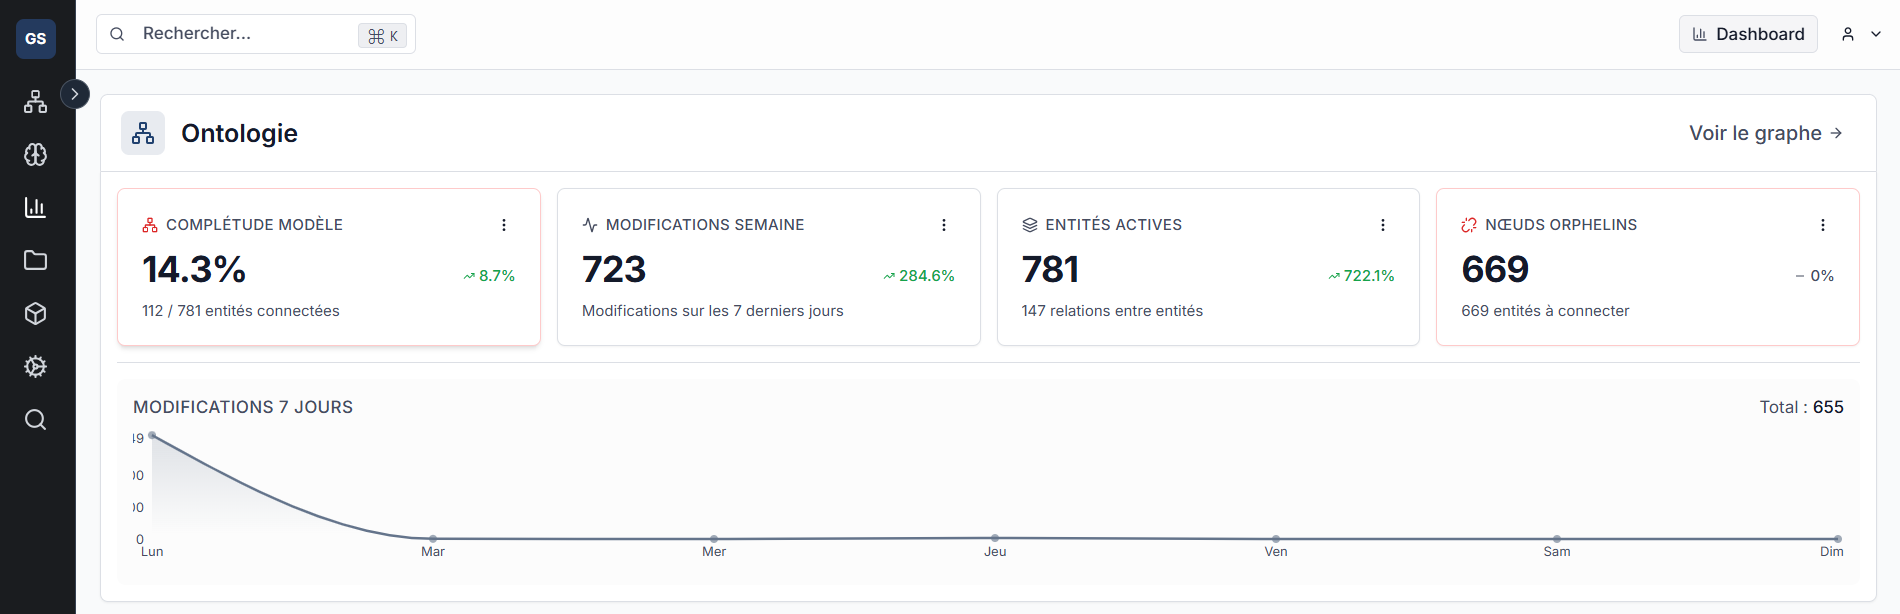
The Ontologie section displays four indicators:
| Indicator | Description |
|---|---|
| Model Completeness | Percentage of connected entities relative to total (e.g. 112 / 781 connected entities = 14.3%) |
| Weekly Changes | Number of changes over the last 7 days, with percentage variation |
| Active Entities | Total number of entities and relationships between them |
| Orphan Nodes | Entities without any relationship -- to be connected to enrich the model |
A 7-day Changes chart displays the daily activity curve (Monday to Sunday) with the total number of changes over the period.
The View graph link in the top right opens the Ontologie module directly.
Workflows
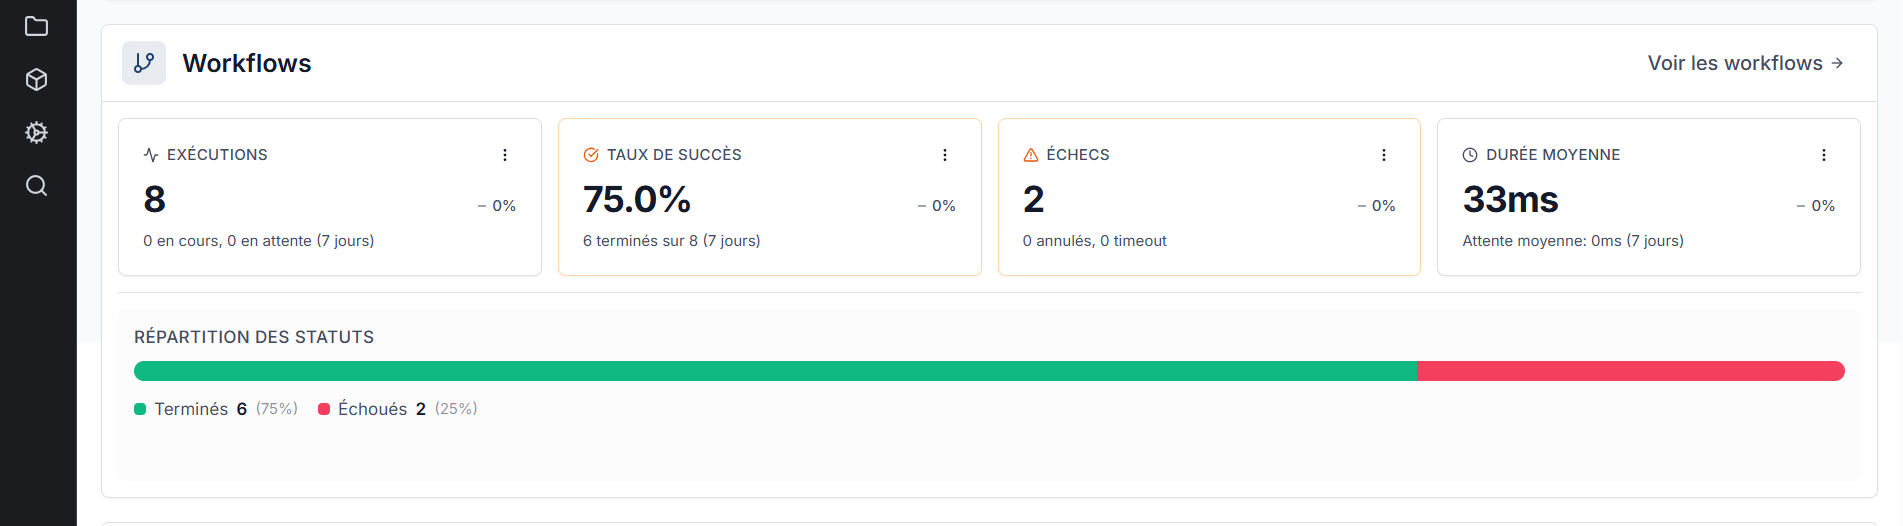
The Workflows section displays four indicators over the last 7 days:
| Indicator | Description |
|---|---|
| Executions | Total number of executions (running, pending, completed) |
| Success Rate | Percentage of executions completed successfully (e.g. 6 completed out of 8 = 75%) |
| Failures | Number of failed executions, with details on cancelled and timeouts |
| Average Duration | Average execution time, with average wait time |
A Status Distribution bar visualizes the proportion between completed (green) and failed (red) executions.
The View workflows link opens the Workflow Builder module.
API Manager
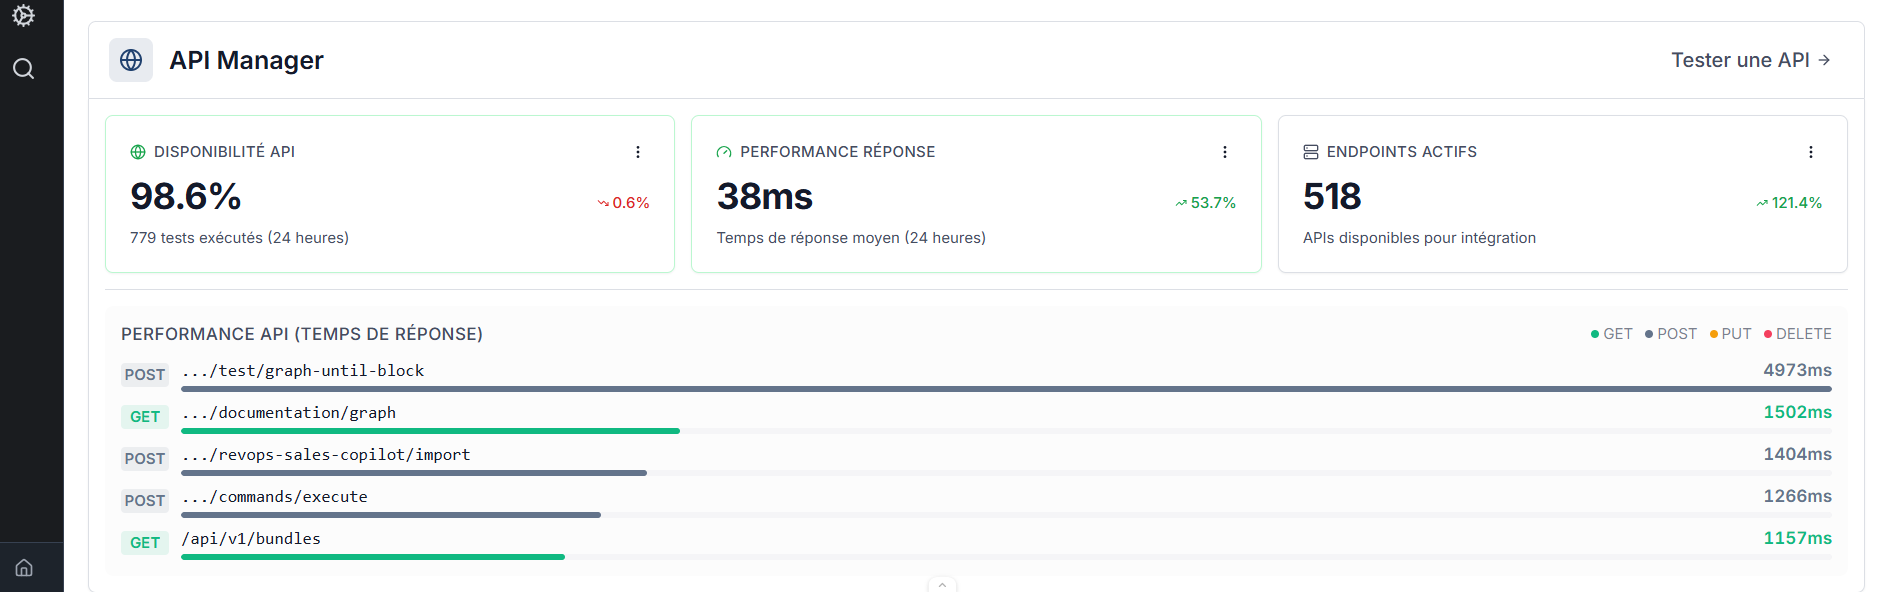
The API Manager section displays three indicators over the last 24 hours:
| Indicator | Description |
|---|---|
| API Availability | Availability percentage based on tests run (e.g. 779 tests, 98.6% availability) |
| Response Performance | Average response time over 24 hours |
| Active Endpoints | Number of APIs available for integration |
An API Performance (Response Time) chart lists the slowest endpoints by HTTP method (GET, POST, PUT, DELETE) with their response time in milliseconds.
The Test an API link opens the API Manager module test panel.
Agent Hub
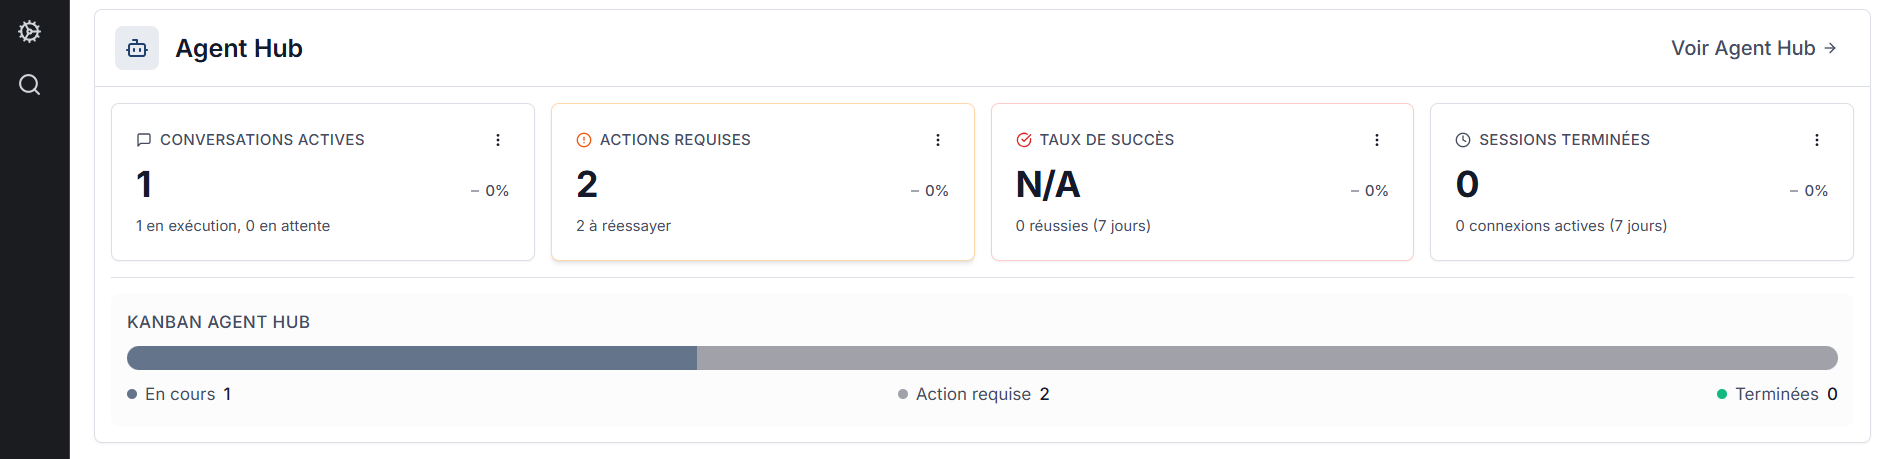
The Agent Hub section displays four indicators over the last 7 days:
| Indicator | Description |
|---|---|
| Active Conversations | Number of ongoing conversations (running and pending) |
| Actions Required | Number of conversations requiring manual intervention (to retry) |
| Success Rate | Percentage of successful conversations over the period |
| Completed Sessions | Number of active connections over the period |
An Agent Hub Kanban bar visualizes the distribution of conversations by status: running, action required, and completed.
The View Agent Hub link opens the Agent Studio module.
Links with other modules
- Ontologie: the Ontologie KPIs reflect the state of your data model.
- Workflows: the Workflows KPIs show the health of your automations.
- AI Agent: the Agent Hub KPIs track the activity of your conversational agents.
Need help?
Contact us: Support and contact.