Track executions
Overview
Monitor all your agent executions in real time from a centralized dashboard. Identify sessions that are in progress, those requiring action, and those that are completed.
Before you begin
- At least one agent has been created and tested. See Test and evaluate.
- One or more executions have been launched (via the test panel or a workflow).
Steps
1. Access monitoring
From the agent gallery, click the Monitoring button in the top bar. You are redirected to the executions dashboard.
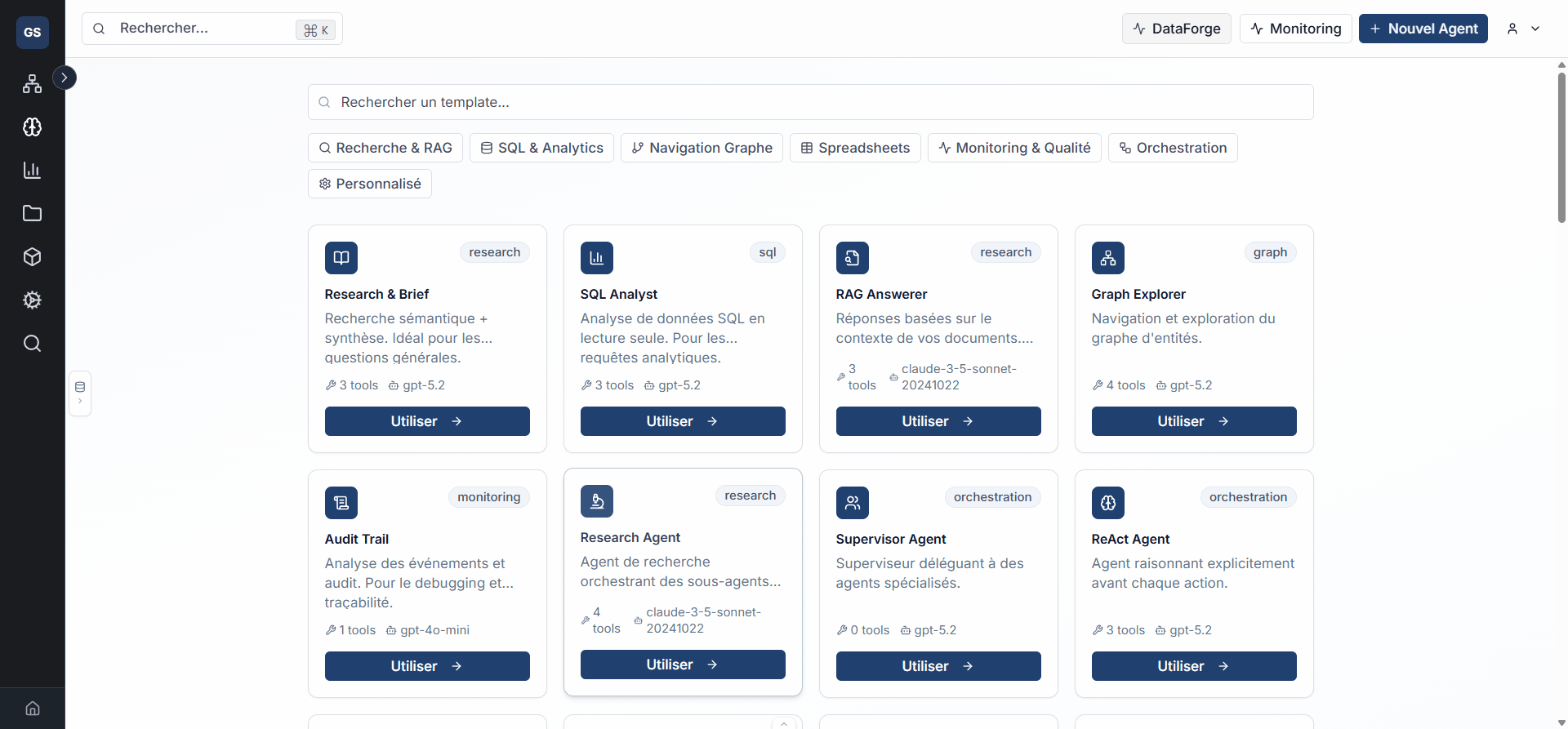
To return to the gallery, click the Studio button in the top left.
2. Kanban view
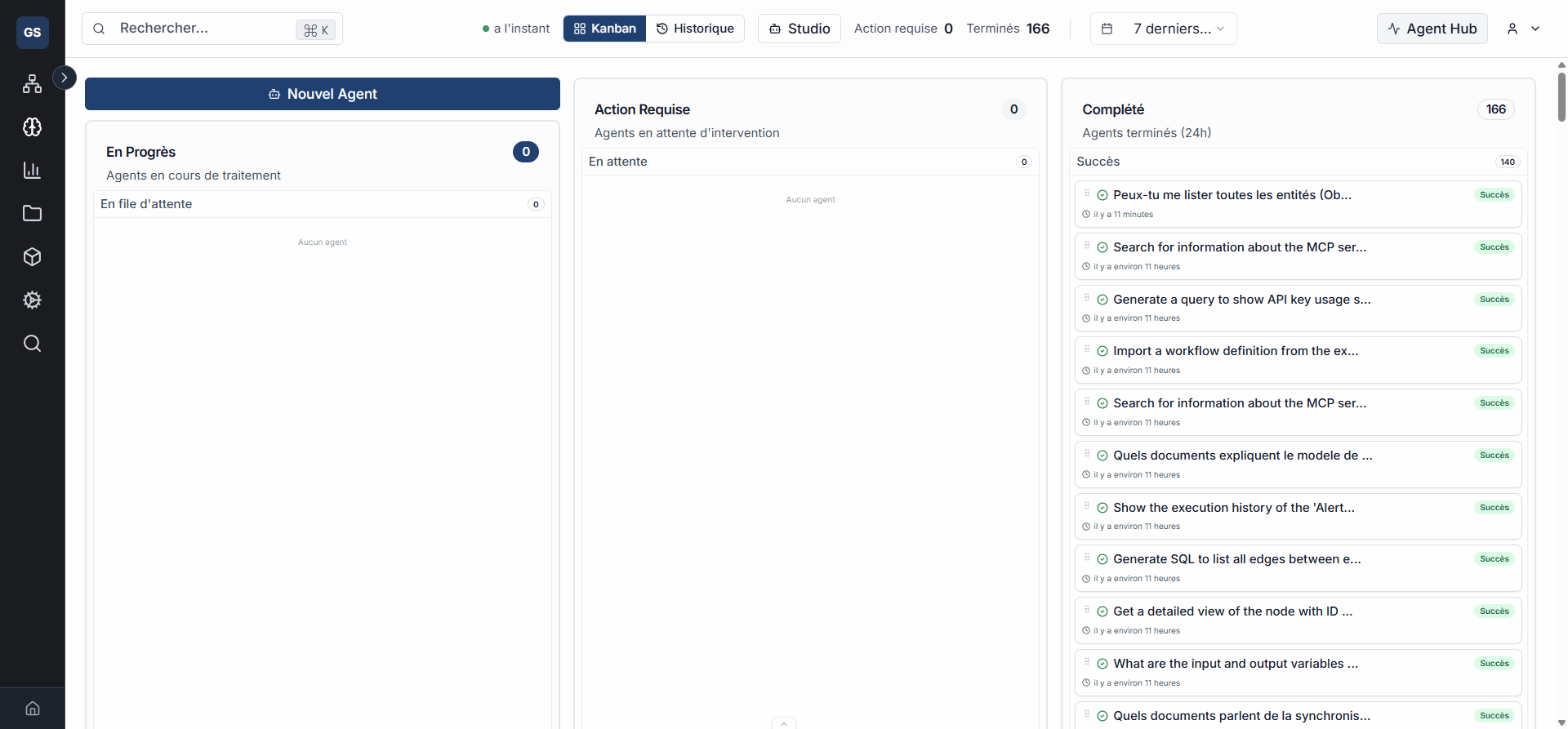
By default, monitoring displays in Kanban view. Executions are distributed across three columns based on their state:
| Column | Content | Meaning |
|---|---|---|
| In Progress | Sessions queued or currently executing | The agent is actively processing a request. |
| Action Required | Sessions awaiting action or that can be relaunched | An intervention is needed to continue. |
| Complete | Finished sessions (success, fatal error, cancelled) | The execution is finalized. |
Each card displays the agent name, the submitted query, the progress percentage, the current step, the duration, and a status badge.
3. Filter executions
Use the filter bar to refine the display:
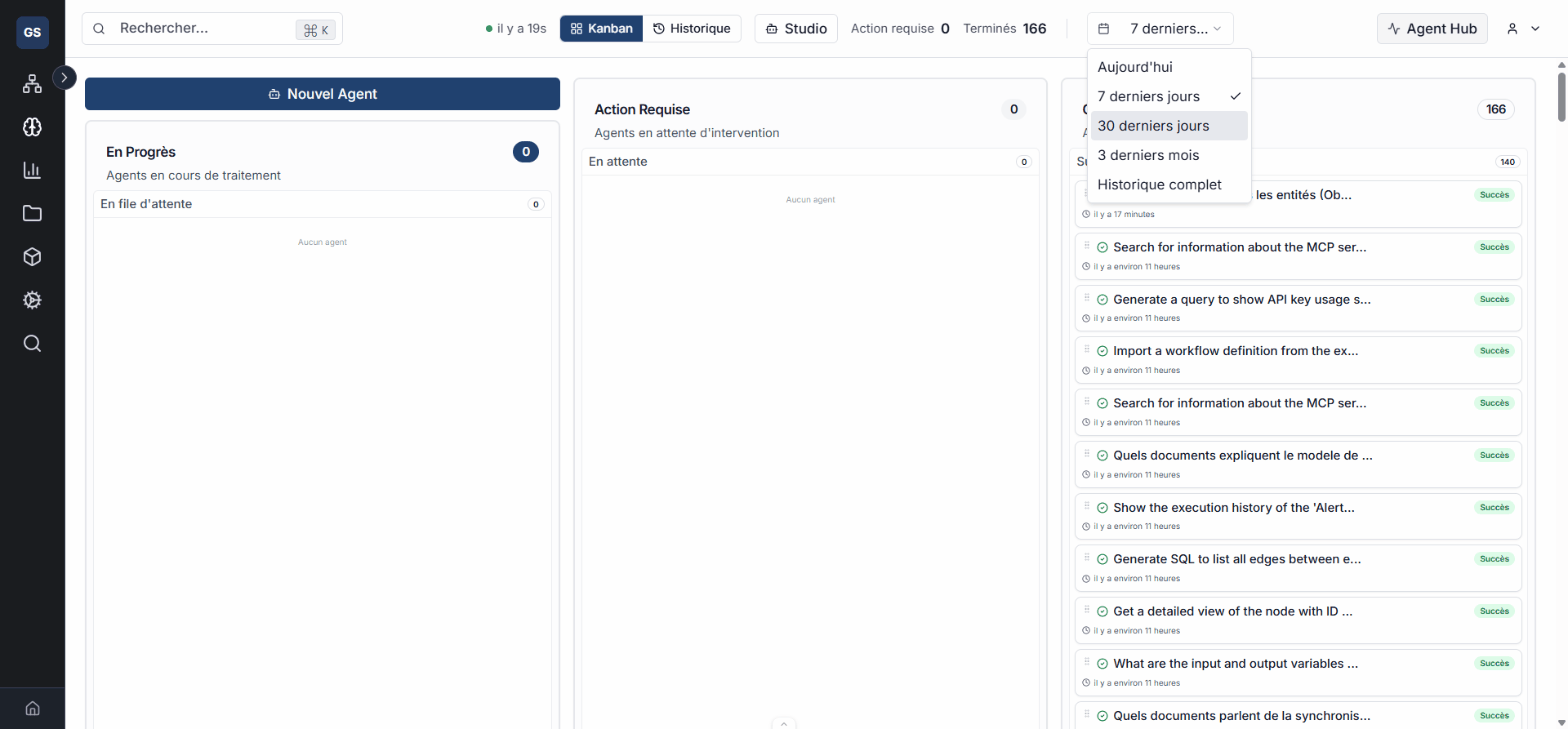
- Period: today, this week, this month, this quarter, or all executions.
- User: filter by the user who launched the execution.
- Status: display only sessions in progress, in error, completed, etc.
- Search: enter a keyword to find an execution by its content or agent name.
Filters can be combined. Modify them at any time to adjust the view.
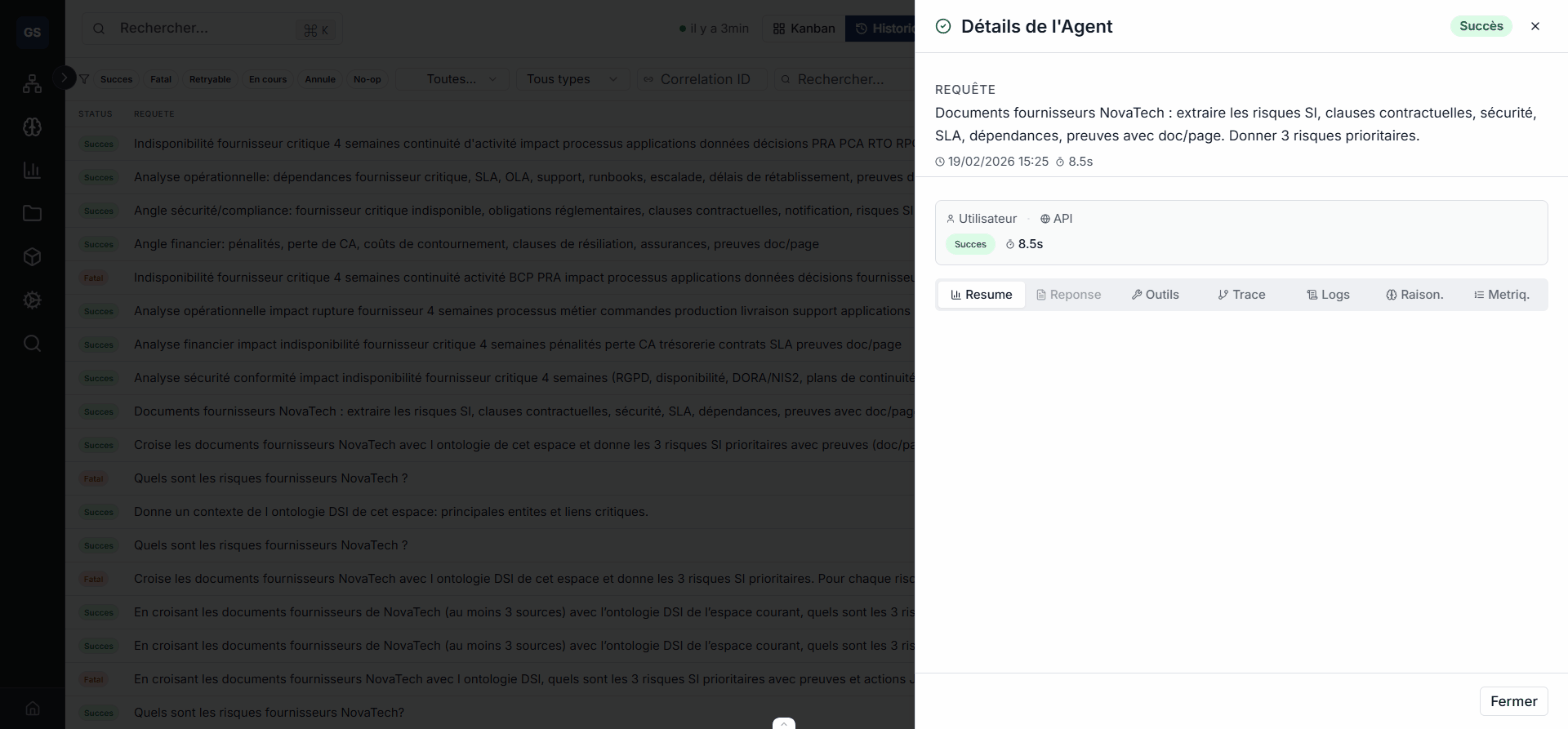
4. View session details
Click on a card to open the session detail panel.
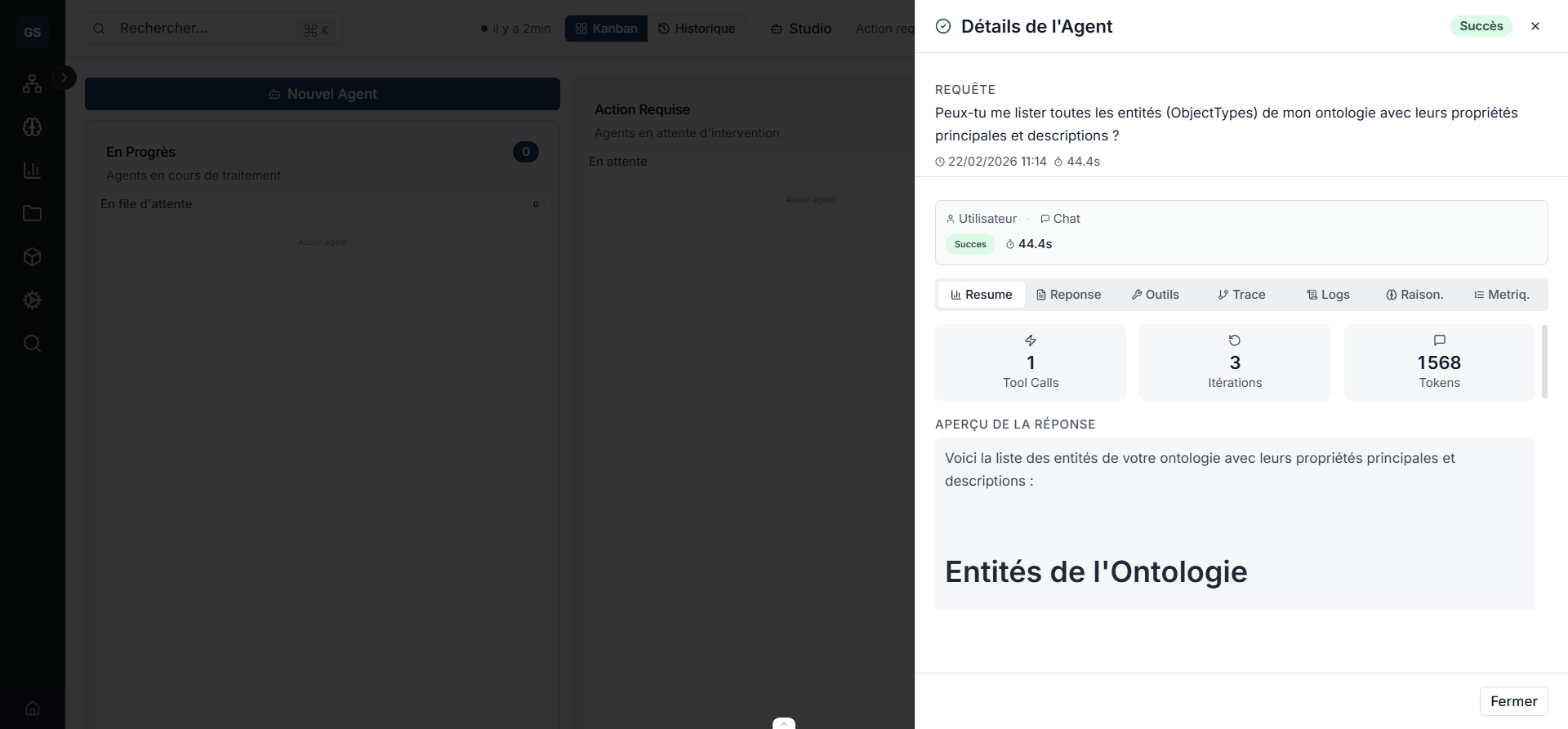
The panel displays:
- The complete query submitted to the agent.
- The list of tools called during execution.
- The total session duration.
- The final response produced by the agent.
This information helps you diagnose unexpected behavior or validate the quality of an execution.
5. History view
Switch to History view via the view selector in the header (Kanban / History). This view displays executions in table format.
| Column | Description |
|---|---|
| Identifier | Unique session reference. |
| Status | Final execution state. |
| Query | Question or instruction submitted to the agent. |
| Agent | Name of the agent that processed the query. |
| Duration | Total execution time. |
| Date | Start and end timestamps. |
The History view is suited for browsing a large volume of past executions or performing precise searches.
6. Real-time connection indicator
A status dot is visible in the dashboard header:

| Indicator | Meaning |
|---|---|
| Green dot | The real-time connection is active. Updates are displayed automatically. |
| Missing or grey dot | The connection is interrupted. A warning banner is displayed. |
If disconnected, the system automatically attempts to reconnect. Data updates as soon as the connection is restored.
Expected result
A real-time view of all your agent executions: sessions in progress, actions to take, and complete history. You can quickly diagnose a problem and monitor the overall activity of your agents.
Limitations and common errors
- If the connection dot is not green, cards do not update automatically. Wait for reconnection or refresh the page.
- Filters are reset when you leave the dashboard. Reapply them when you return.
- The Kanban view displays recent executions. To find an older session, use the History view with the appropriate period filter.
- The detail of a session in progress updates progressively. The final response only appears once the execution is complete.
Next steps
- Test and evaluate: adjust an agent's configuration based on observed results.
- Configure tools: modify an agent's capabilities if executions show a need for adjustment.
Need help?
Contact us: Support and contact.