Graph View
At a glance
The Graph View provides a visual representation of the links between your documents, sources, and entities. It lets you discover connections that linear reading does not reveal.
Before you start
- You have imported at least a few documents in the Knowledge Base.
- Document processing (extraction, indexing, entity detection) is complete.
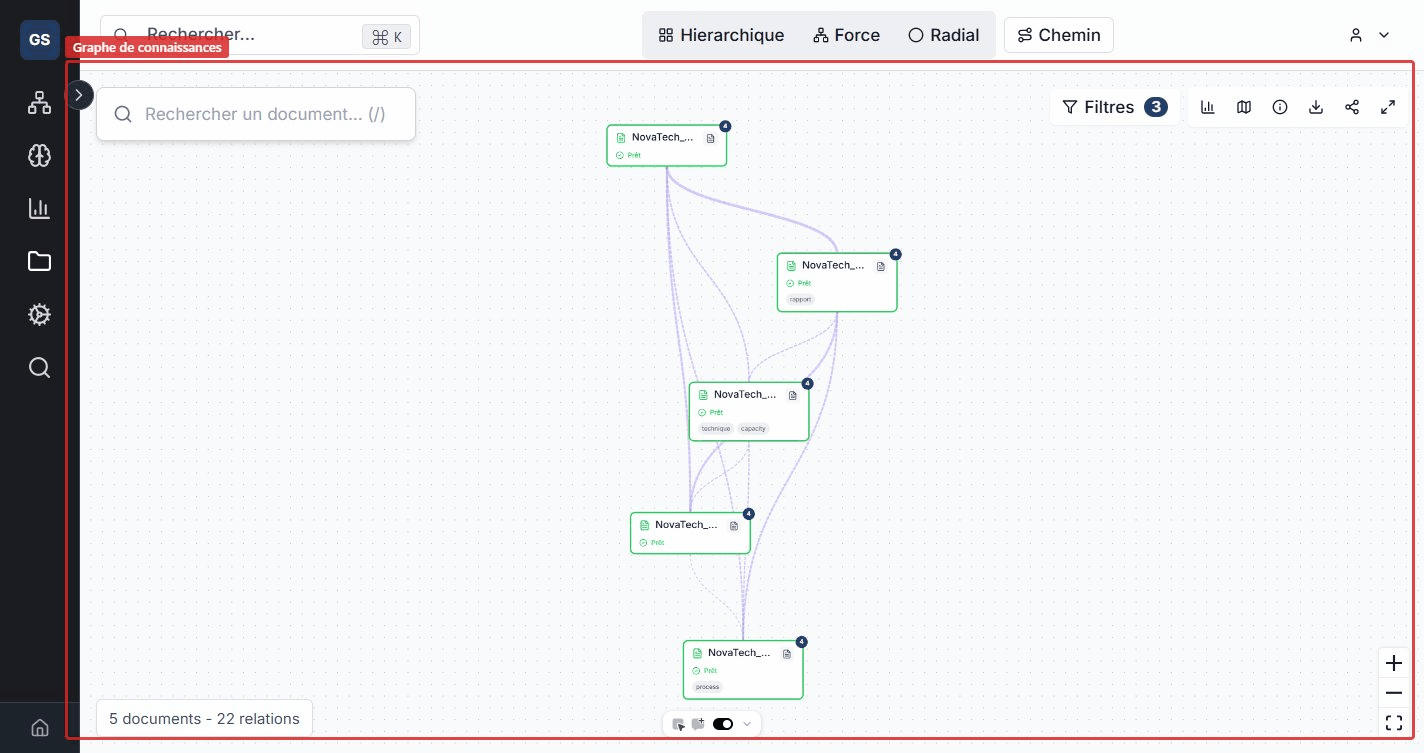
Each node represents a document. Links between nodes indicate an automatically detected relationship.
Toolbar
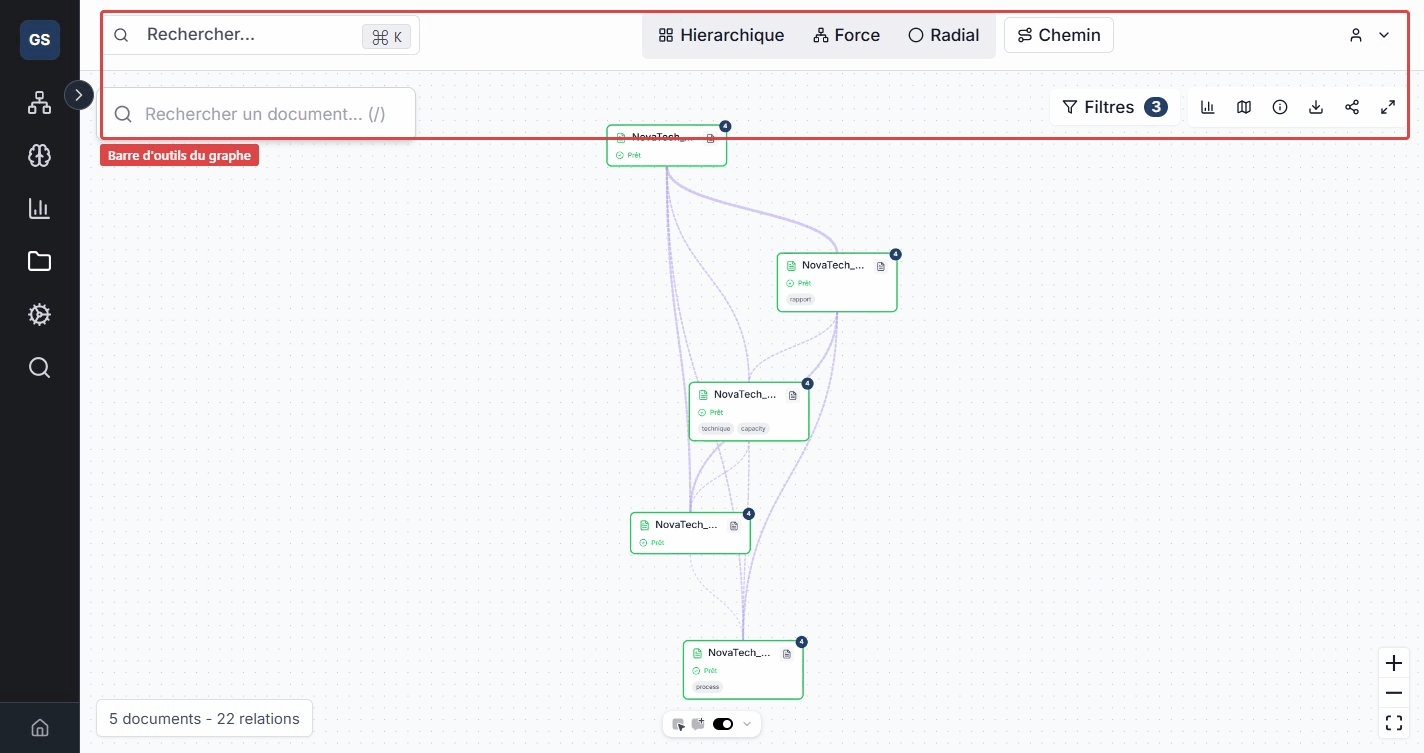
The toolbar at the top of the graph gives you access to the main features:
- Search: find and highlight a document in the graph.
- Layout: choose from four display modes -- Hierarchical (tree), Force (physics simulation), Radial (concentric circles), or Path (linear path).
- Filters: open the filter panel to refine the displayed relationships.
- Export: export the graph as an image.
Relationship filters
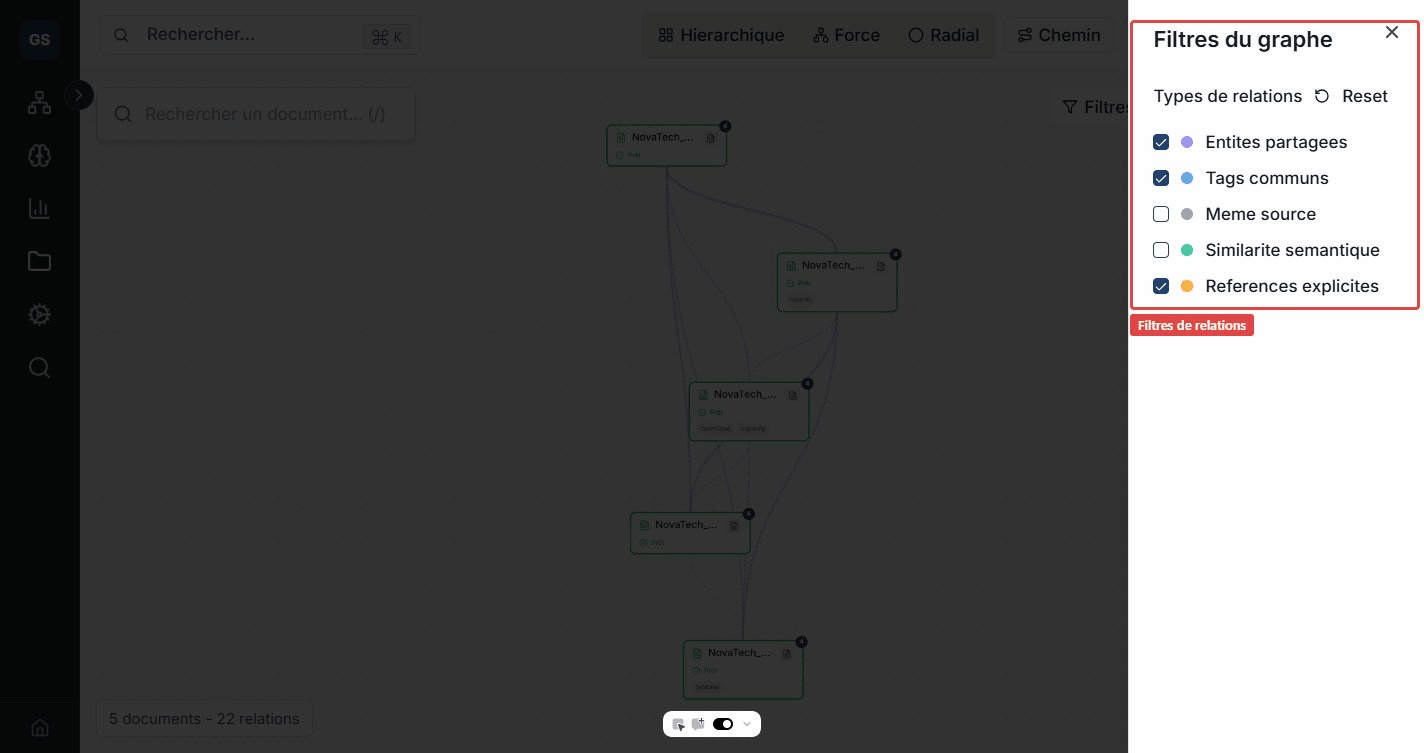
The filter panel lets you control which types of links are displayed:
- Shared entities: documents mentioning the same business entities (for example, two reports citing the supplier "Dupont & Fils").
- Common tags: documents with identical tags (for example, all documents tagged "compliance").
- Explicit references: direct links between documents (citations, cross-references).
- Semantic similarity: documents with similar content, detected through text analysis. Adjust the similarity threshold (from 0.5 to 1.0) to show more or fewer links. A threshold of 0.8 means only documents very close in content will be connected.
- Same source: documents from the same external source (for example, all files imported from the same GitHub repository).
Combine multiple filters to isolate exactly the relationships you are interested in.
Document preview
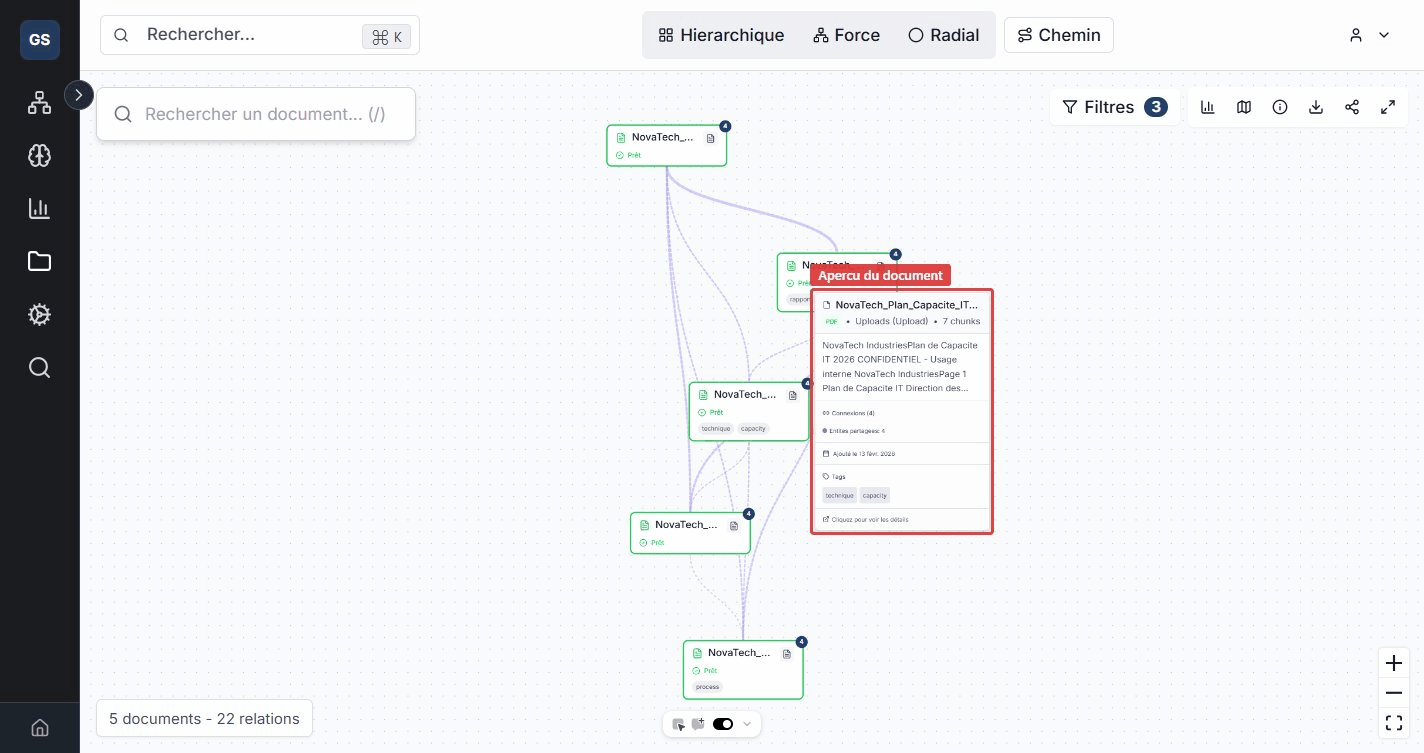
Hover over a node to see a quick preview without leaving the graph view: document name, type, number of indexed segments, number of connections, and associated tags.
Document detail
Click a node to open the side detail panel. This panel has five tabs that give you a complete view of the document and its relationships.
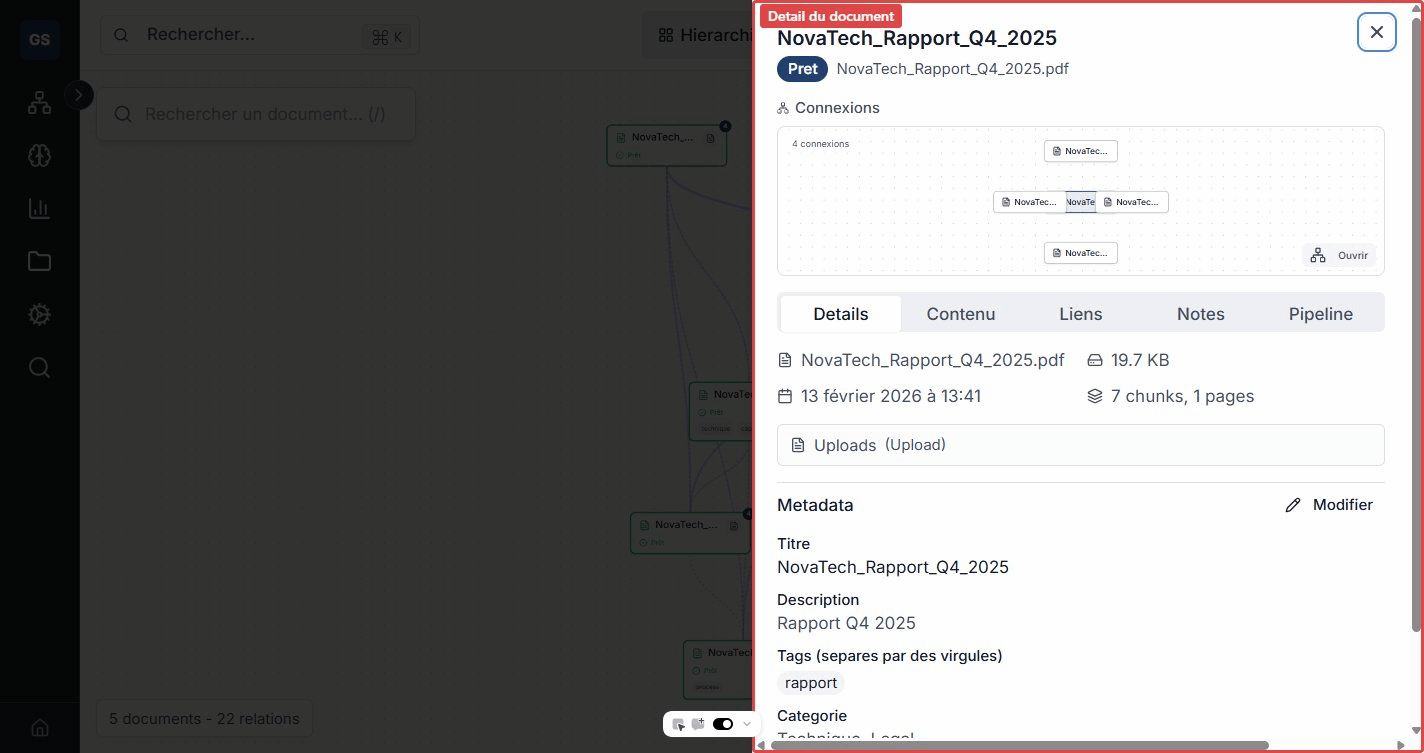
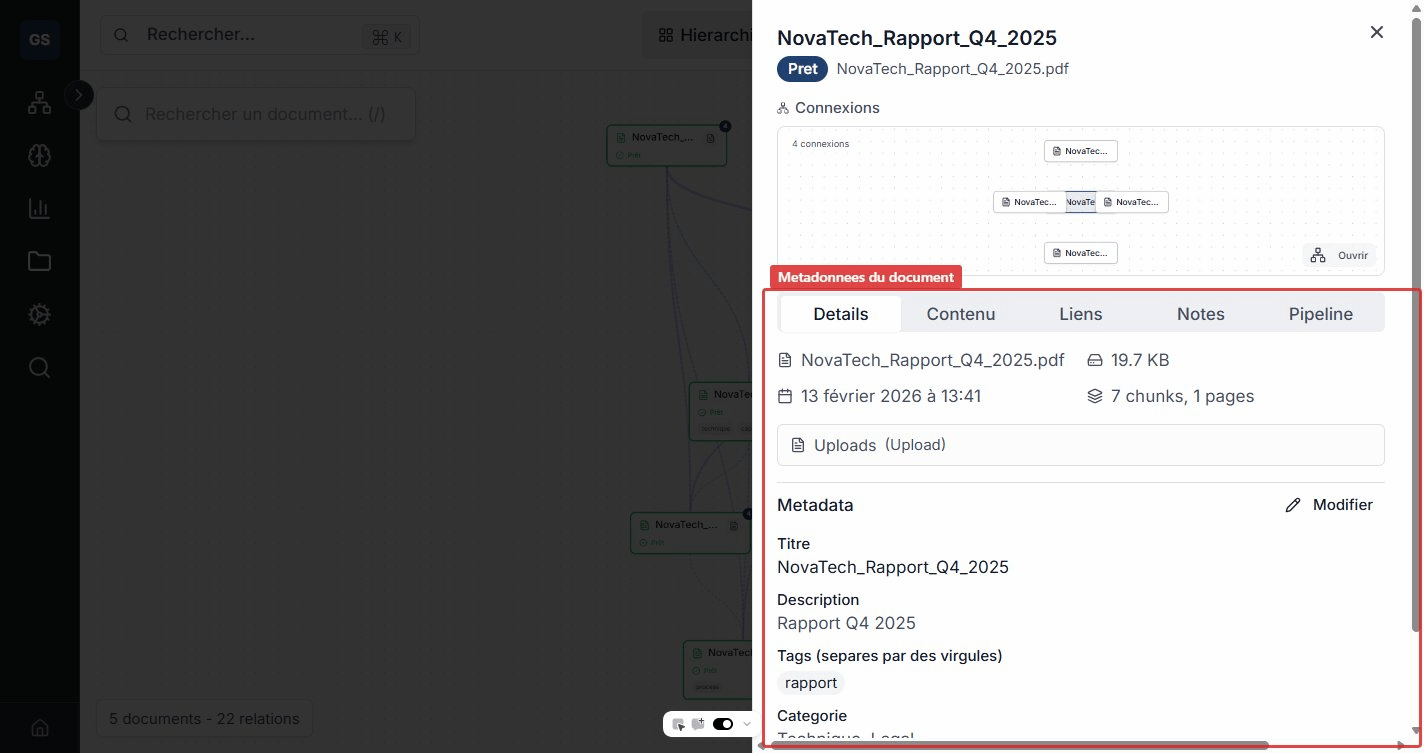
Details tab
General document information: file name, size, date added, number of indexed segments, and origin source. You can also view and edit the metadata (title, description, category, tags).
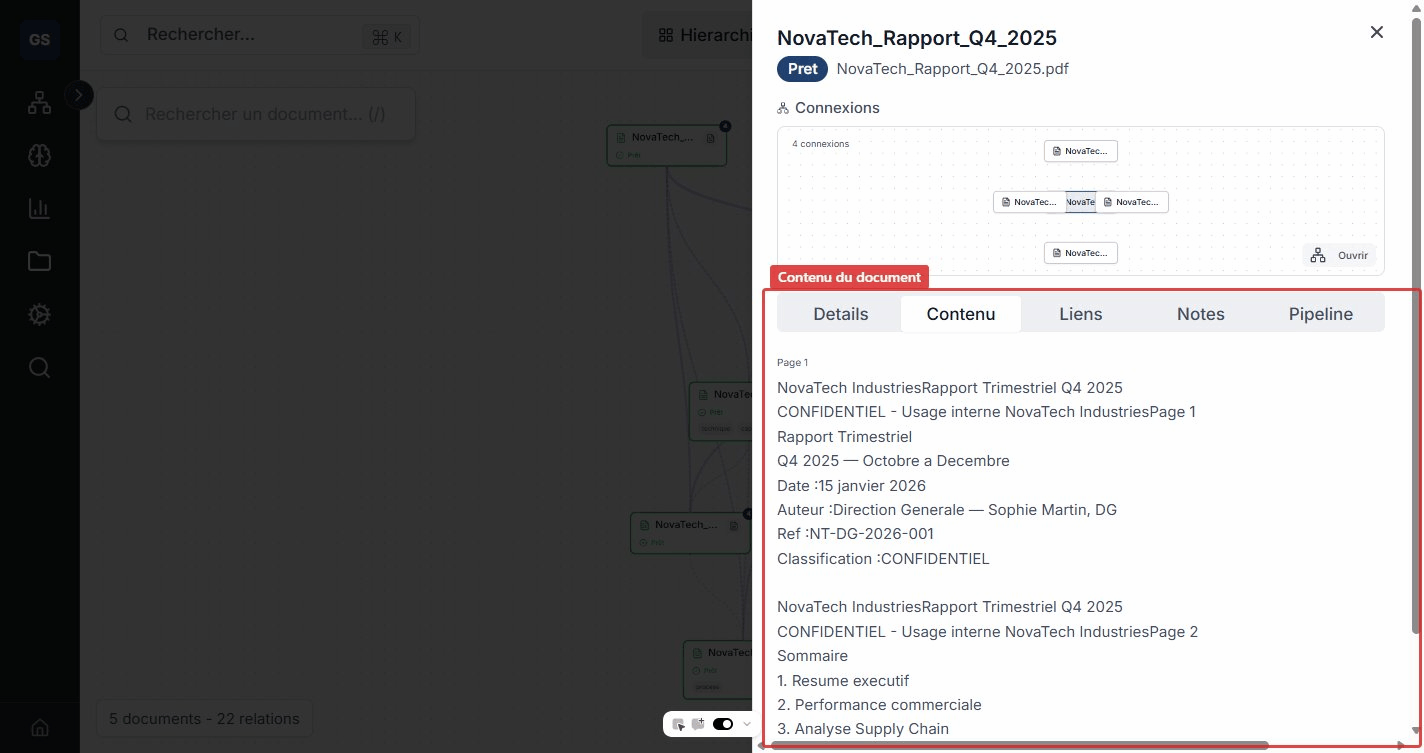
Content tab
Text extracted from the document, organized by pages or sections. This tab lets you read the content without leaving the graph, and quickly check whether a document is relevant.
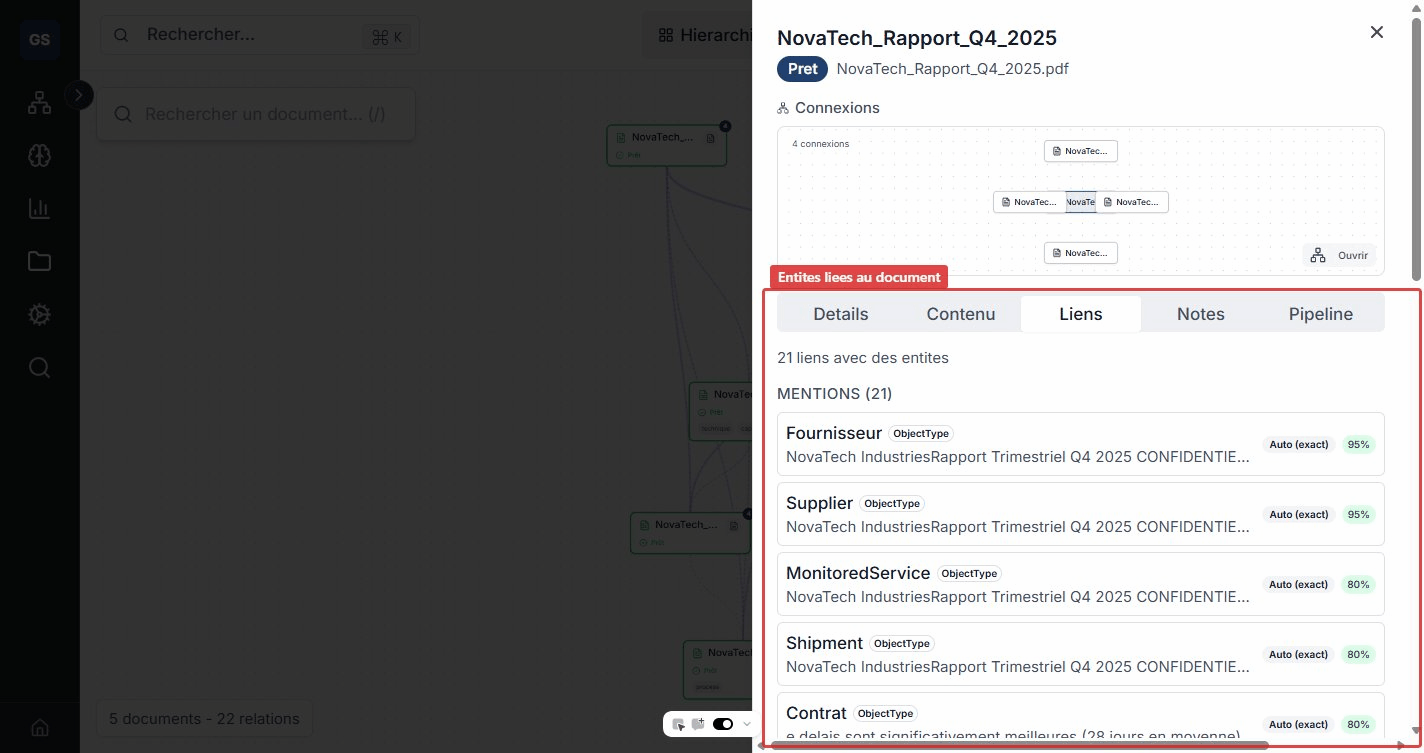
Links tab
List of entities automatically detected in the document. Each entity shows its type (person, organization, concept, location, etc.), the relevant passage, and a confidence score.
Example: in an audit report, the system may detect "ACME Corp" (organization), "Paris" (location), and "ISO 9001" (concept). These entities are linked to your ontology, enriching both the document graph and your business model.
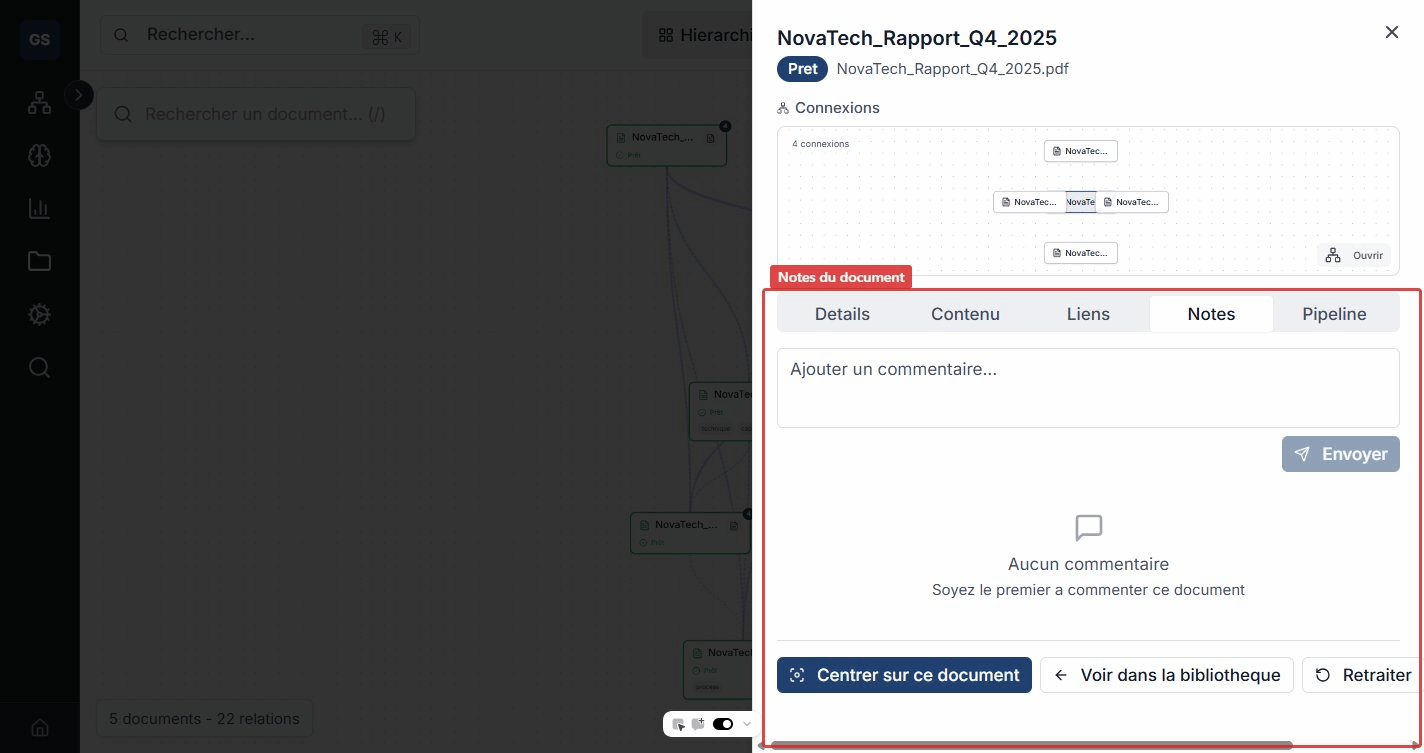
Notes tab
Add comments and annotations on a document. Useful for sharing observations with your team or noting points of attention.
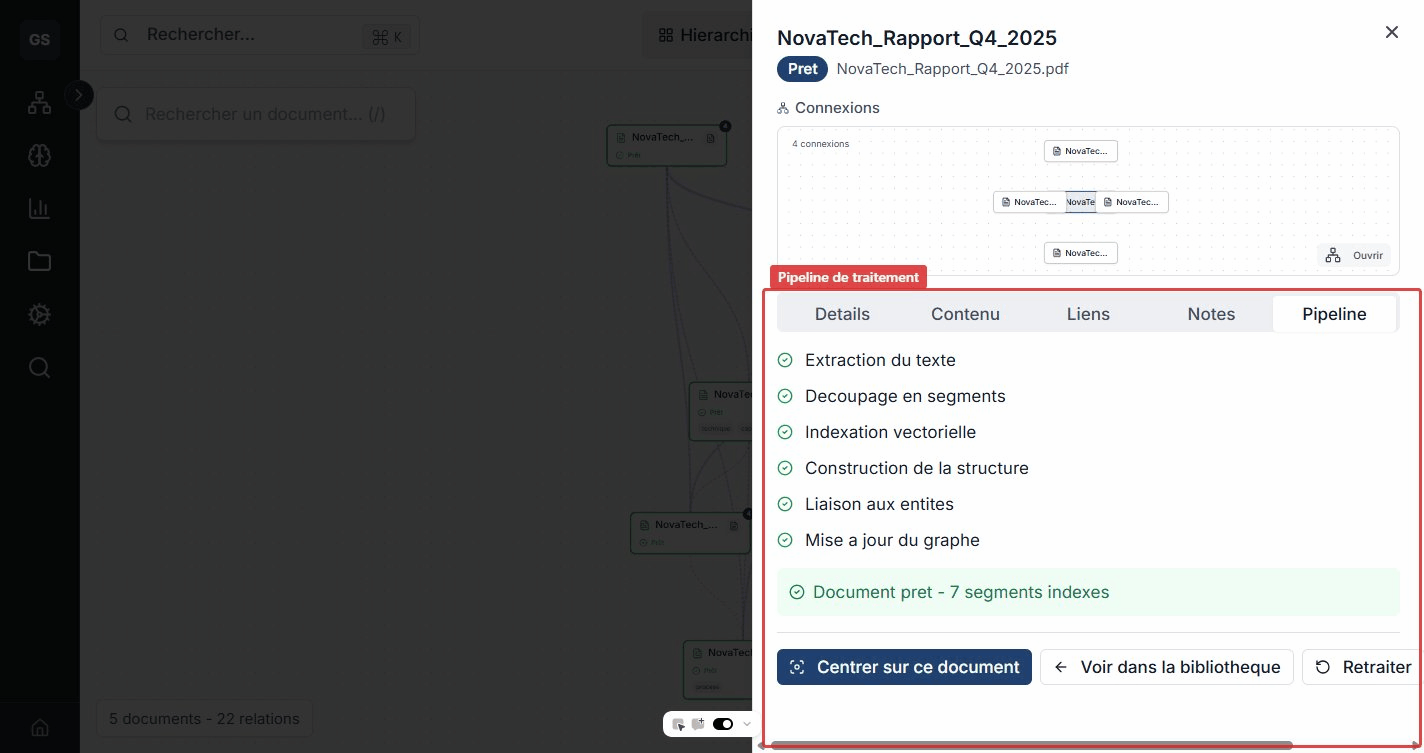
Pipeline tab
Tracking of the document processing steps: text extraction, segment chunking, semantic indexing, structure building, entity linking, and graph update. Each step shows its status (completed, in progress, error) so you can quickly diagnose any issue.
Tips
- Change the layout to reveal different structures: Hierarchical mode highlights groups, Force mode shows natural clusters.
- Adjust the similarity threshold: a low threshold (0.5) shows more links, a high threshold (0.9) keeps only the strongest relationships.
- Combine filters: enable only "Shared entities" to see which documents discuss the same business topics.
- Click a link (edge) to see the detail of the relationship between two documents.
Expected outcome
You can visualize the relationships between your documents in an interactive graph. Shared entities, common tags, and semantic similarities reveal connections invisible to linear reading.
Need help?
Write to us: Support and contact.