Run and debug
At a glance
Launch a test run, analyze the results block by block, and fix errors.
Before you start
- Your workflow is created and saved (see Create a workflow).
- The blocks are connected and configured.
Steps
1. Launch a test
From the canvas, click the Test button (play icon) to launch a synchronous execution of your workflow. The test runs the entire workflow and shows you the result immediately.

2. Follow the progress
Follow the execution in real time: each block lights up as it is processed. You can see which block is currently running at any moment.
3. View the results
Once the execution is complete, a panel displays each block's outputs, execution durations, and the overall status (success or failure).

Click on an individual block to see:
- The input data received by the block.
- The output data produced.
- The duration of the block's execution.
- Any logs.
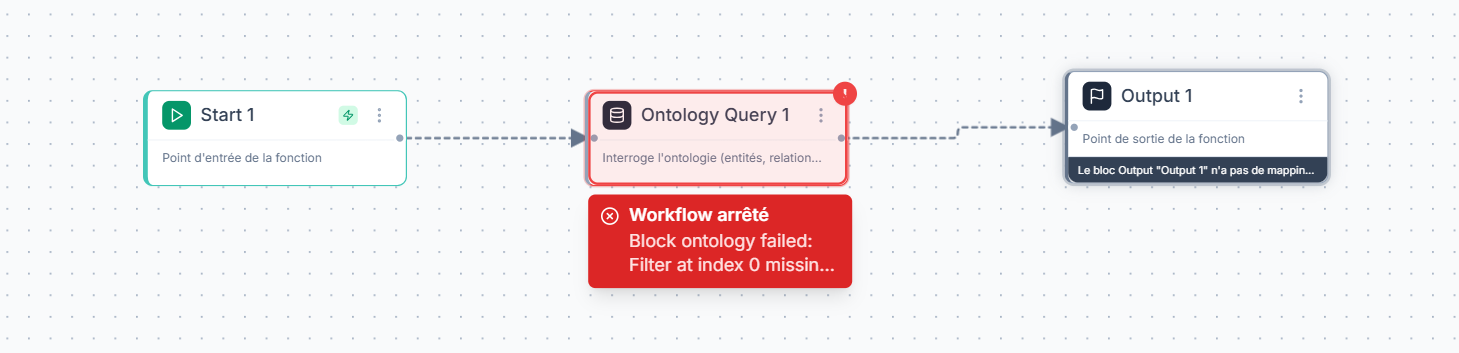
4. Diagnose errors
In case of an error, the failed block is highlighted in red. Click on it to see the problem details.
| Symptom | Likely cause | Solution |
|---|---|---|
| Block in error (red) | Misconfigured parameters | Open the block, check required fields |
| Execution stuck | Infinite loop or always-true condition | Check the loop exit condition |
| Unexpected result | Incorrect data mapping between blocks | Check the input and output variables of each block |
| Timeout | Execution too long | Reduce the workflow scope or add a timeout block |
5. Fix and re-test
Fix the configuration of the failing block, save the workflow, and re-run the test. Repeat until you get a complete error-free execution.
Use the Test button for quick validations during construction. For production or scheduled executions, use the Run button which launches a durable execution with tracking and automatic recovery in case of interruption.
Expected outcome
Your workflow runs without errors from the first to the last block. The results of each step are visible and match your expectations. The workflow is ready for production use or scheduling.
Limits and common issues
- Test mode is synchronous: it waits for the execution to finish. For long workflows, prefer the Run mode.
- If a block fails, the subsequent blocks are not executed (unless an error handling block is configured).
- Dynamic variables (from a previous block) are only available at runtime. Check variable names if a block displays "variable not found".
6. Review a past execution
From the Executions tab in the bottom panel, browse the history of all workflow executions. Each entry shows the status, duration, and trigger.
Click the View on canvas icon (eye) to load the execution result directly on the graph:
- Successfully executed blocks display with a green (teal) border
- The failed block displays in red with the error message
- Traversed connections are colored green
- The canvas automatically centers on the failed block
Click any block to see its input and output data at the time of execution.
To exit review mode, click Exit review in the banner.
7. Pin data for replay
After executing or loading an execution, you can pin a block's data to reuse it during the next test:
- Click on an executed block
- In the popup, click Pin
- The block shows a violet border and a pin icon
During the next test, the pinned block will not re-execute: its frozen data will be directly passed to downstream blocks. This allows you to:
- Reproduce a bug with exactly the same data
- Speed up testing by skipping slow API calls
- Simulate edge cases by editing the pinned data
To remove the pin, click the Pin button again in the block popup.
Need help?
Write to us: Support and contact.