Agent Studio v2: OODA Visualizer, Multi-Framework Support, and Advanced Monitoring
Agent Studio takes a major leap forward. Version 2 brings a real-time OODA visualizer to understand how your agent reasons, multi-framework support to choose the best AI engine for each use case, and advanced monitoring to track agent performance and costs in production.
Why Agent Studio v2
Agent Studio v1 allowed you to create, configure, and test AI agents. But in production, several needs emerge:
- Understanding: when an agent gives an unexpected answer, why? Which step in its reasoning went wrong?
- Engine choice: different use cases require different models and frameworks. A triage agent doesn't have the same needs as a data analysis agent.
- Production tracking: how many executions, what success rate, what cost per request, which tools are used most?
Version 2 addresses all three of these needs with visual tools and actionable metrics.
What's New
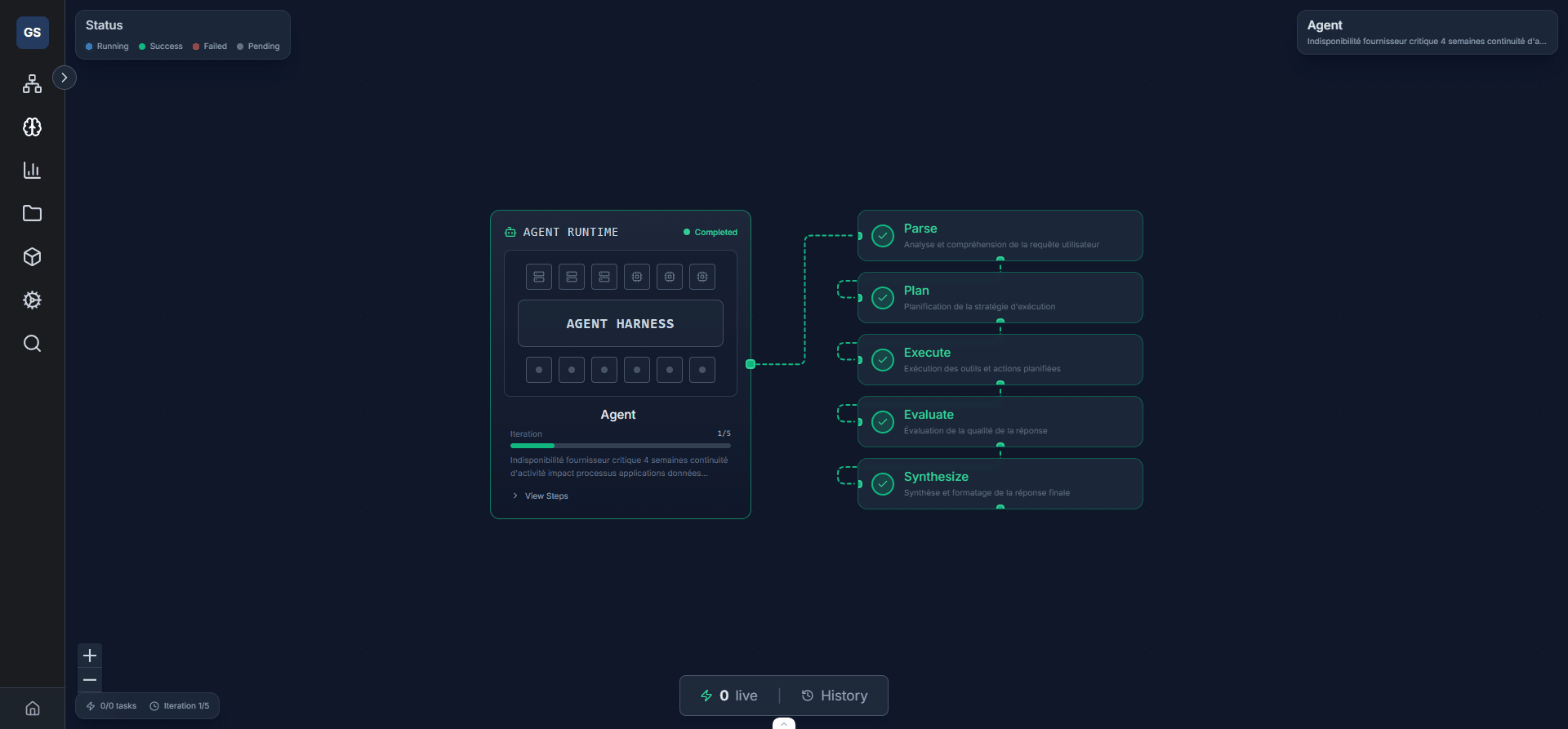
Real-Time OODA Visualizer
At the core of Agent Studio v2 is the OODA visualizer. It displays your agent's reasoning steps in real time following the OODA loop (Observe, Orient, Decide, Act):
What you see:
- The reasoning flow: each step is represented visually on an interactive canvas. You follow the path the agent took from the initial query to the final response.
- Tools used: which tools the agent chose to use, with what parameters, and what results they returned.
- Decisions: at each branching point, you see why the agent chose one path over another.
- Timing: how long each step took, and where the bottlenecks are.
- Feedback loops: when the agent re-evaluates its results and decides to retry or refine its response.
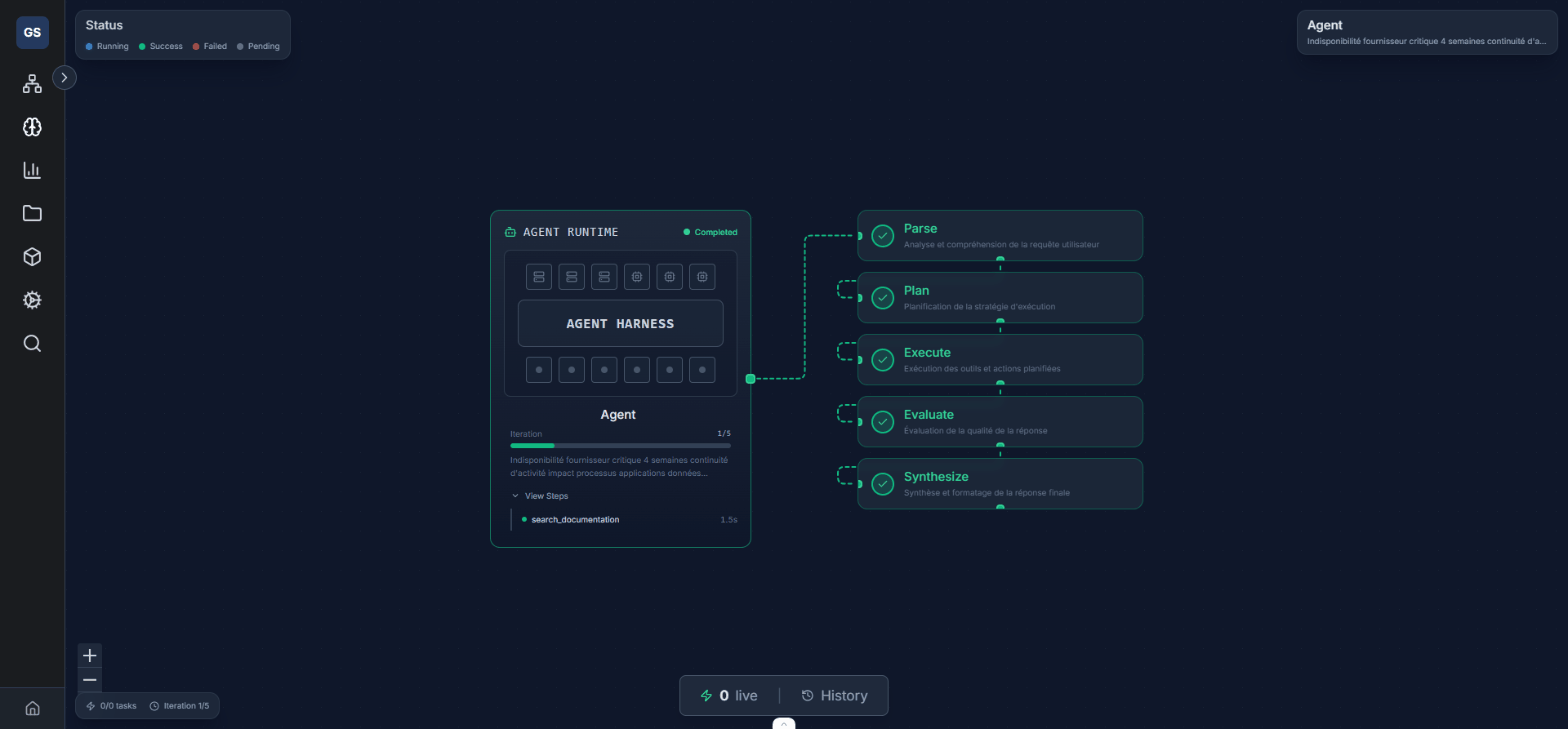
Real-time updates: while an agent is running, the visualizer updates live. You see each node activate, each decision being made, each tool executing — like a visual debugger for AI.
Practical example: a user asks "Which clients don't have an active contract?" and the agent responds with an incomplete list. By opening the visualizer, you see that the agent used a keyword search instead of a structured query, which missed clients whose names didn't contain the word "client." You adjust the search tool configuration and the problem is resolved.
Multi-Framework Support
Agent Studio v2 supports multiple AI frameworks so you can choose the best fit for each use case:
| Framework | Level | Use Case |
|---|---|---|
| Ax (Signatures) | 1-2 | Simple queries, structured extraction, classification |
| OpenAI Agents SDK | 3 | Conversational agents, multi-agent orchestration |
| Google ADK | 5 | Evaluation and benchmarking, complex agents |
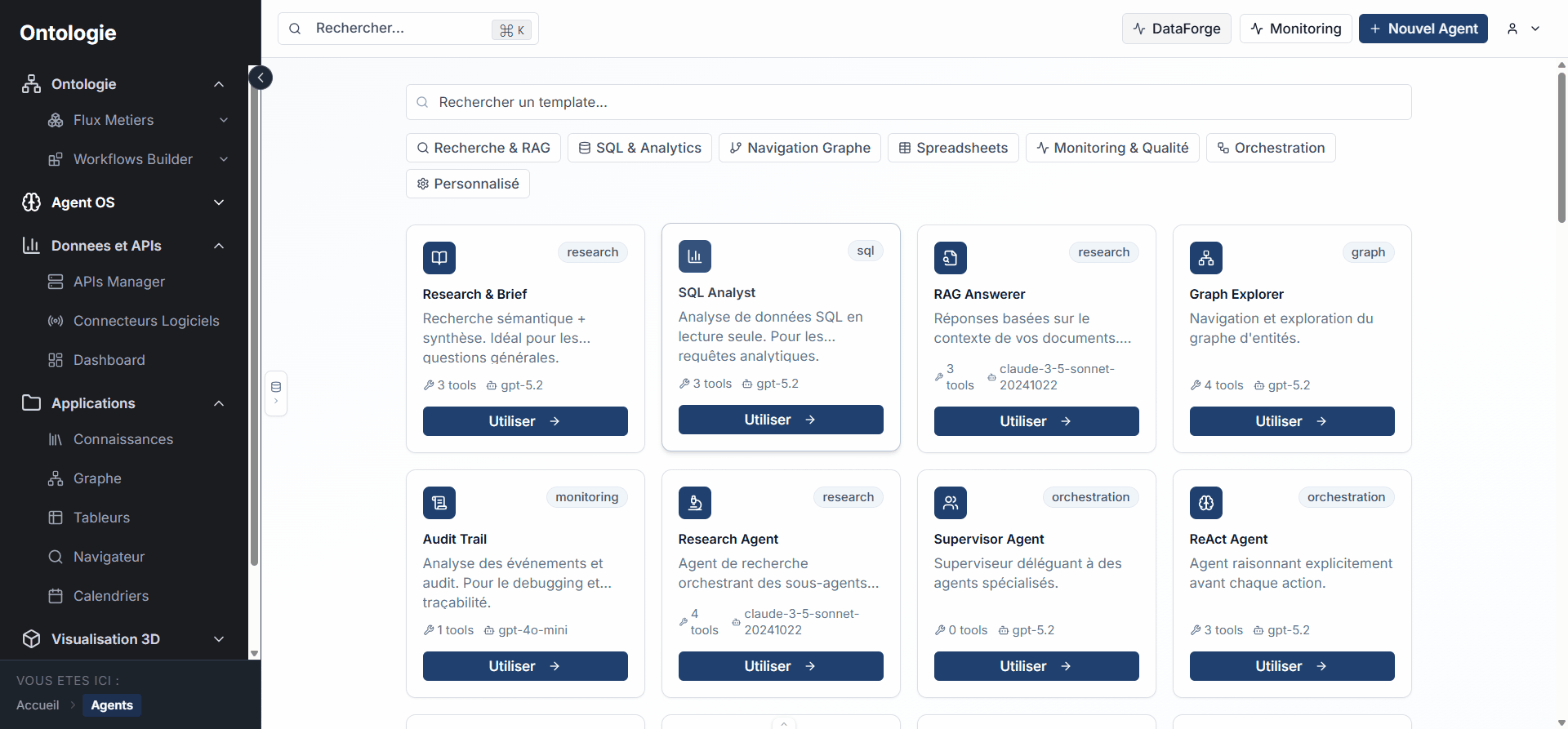
How it works:
- Framework selection: when creating an agent, select the appropriate framework in the editor.
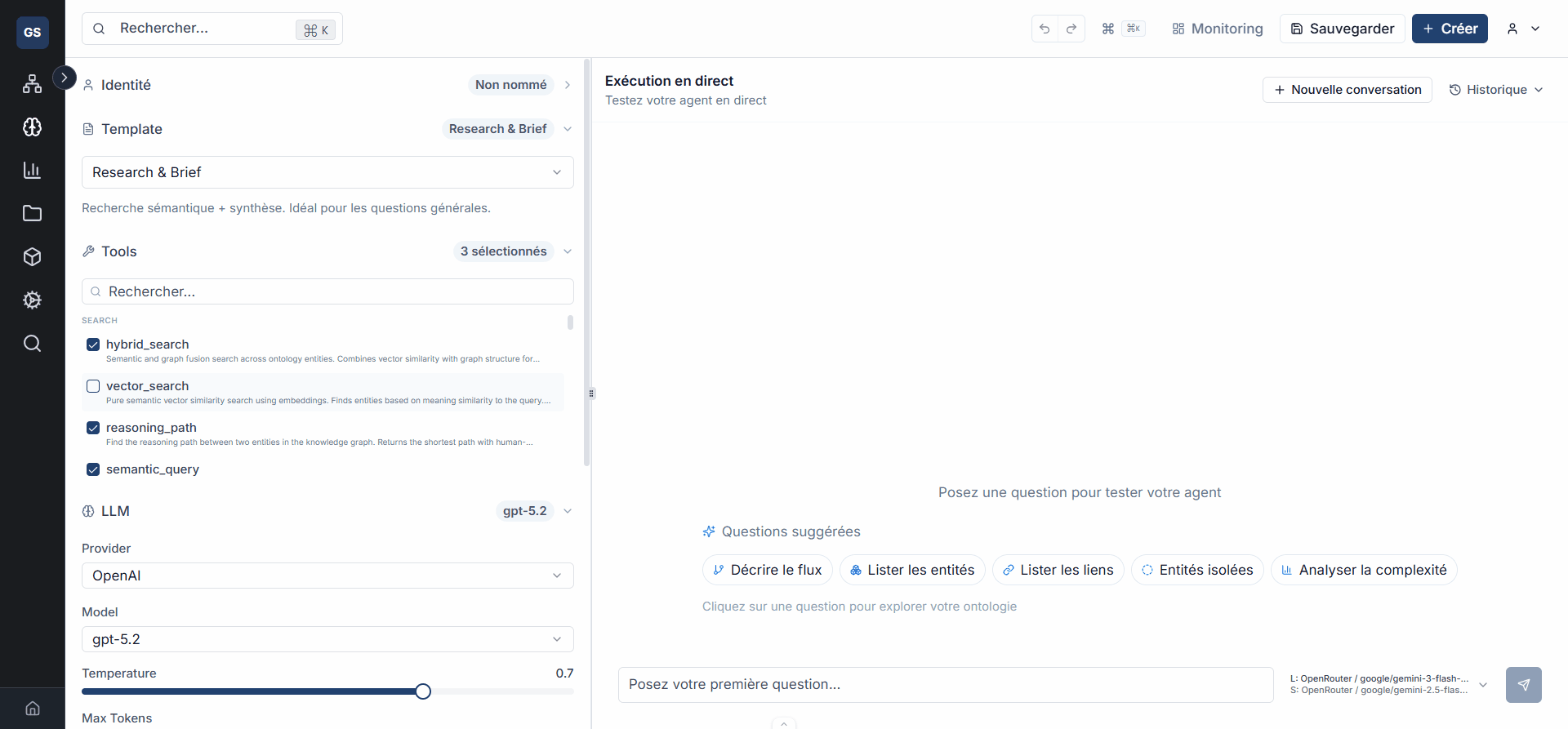
- Framework-specific configuration: each framework has its own parameters (Ax signatures, routing strategies, etc.).
- Same interface: regardless of the framework, Agent Studio provides the same creation, testing, and monitoring experience.
- Easy migration: switch frameworks without reconfiguring your tools and integrations.
Practical example: for a ticket classification agent, you use Ax (fast, low cost). For a complex data analysis agent, you switch to the native agent with the full OODA loop. Both agents are created and managed in the same interface.
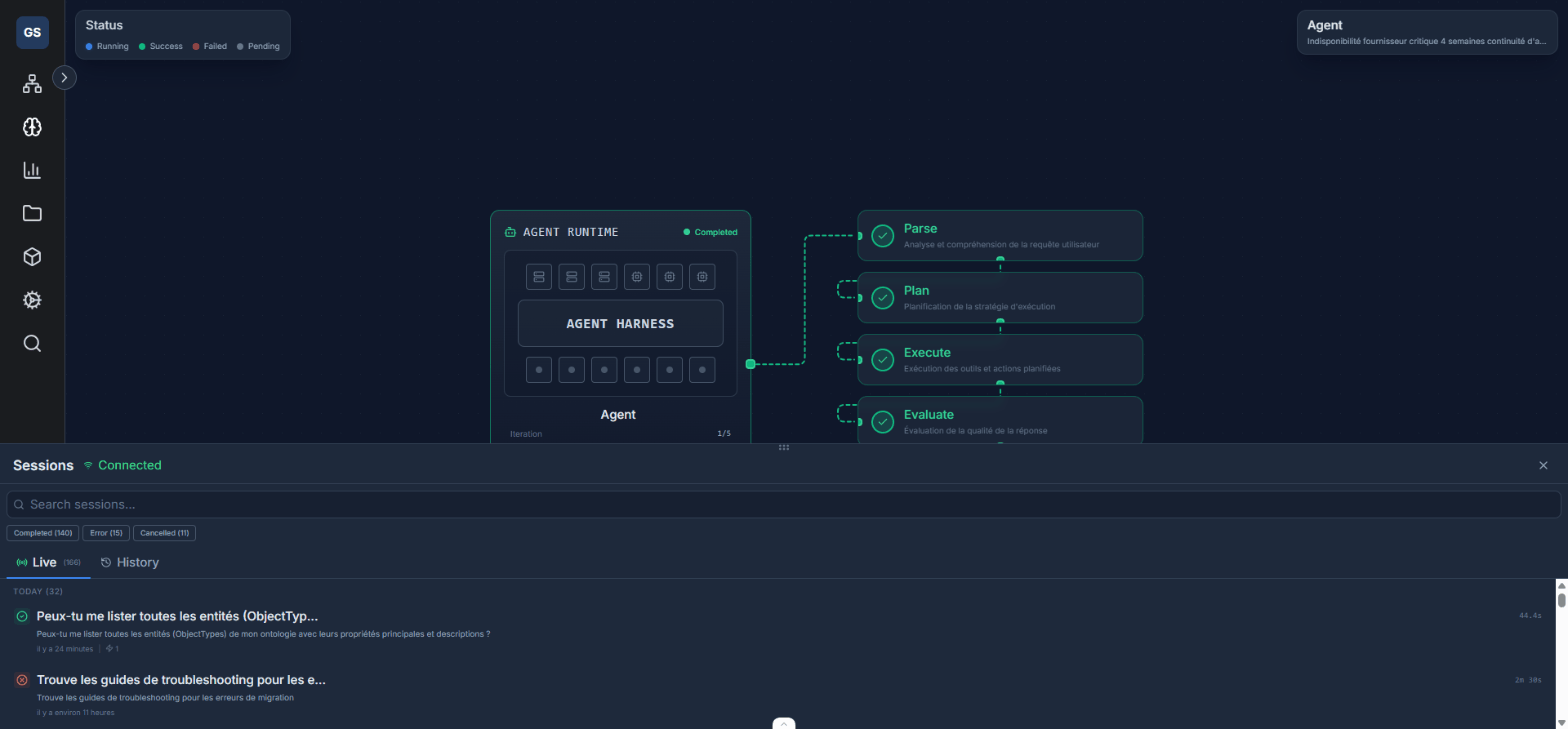
Advanced Monitoring
The monitoring Hub provides a comprehensive view of your agents' activity in production:
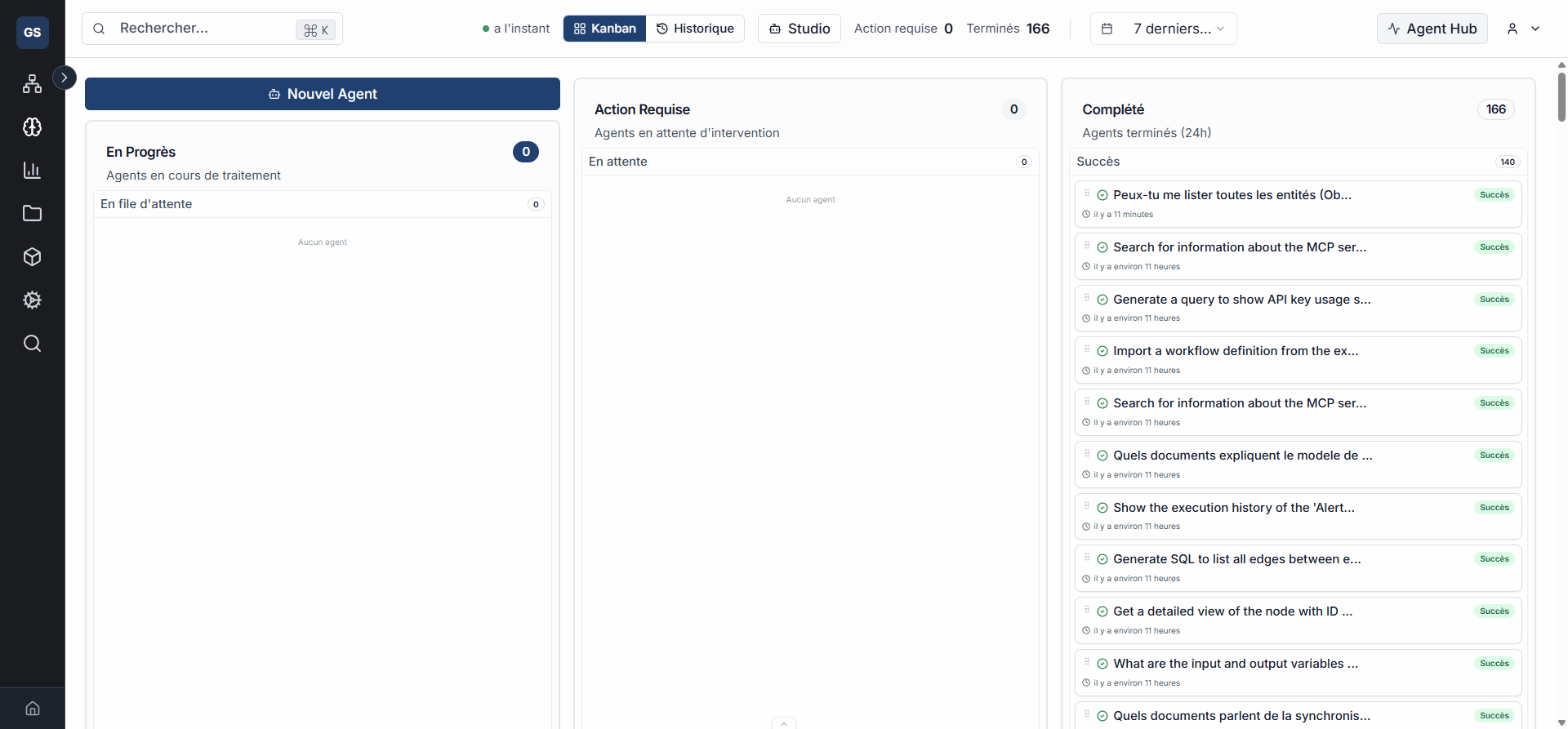
Kanban dashboard: visualize running, successful, and failed executions in a real-time kanban view.
Detailed metrics:
- Volume: number of executions per hour, day, and week.
- Success rate: percentage of requests processed successfully.
- Latency: average response time, p50, p95, p99.
- Tools: which tools are used most, which ones fail most often.
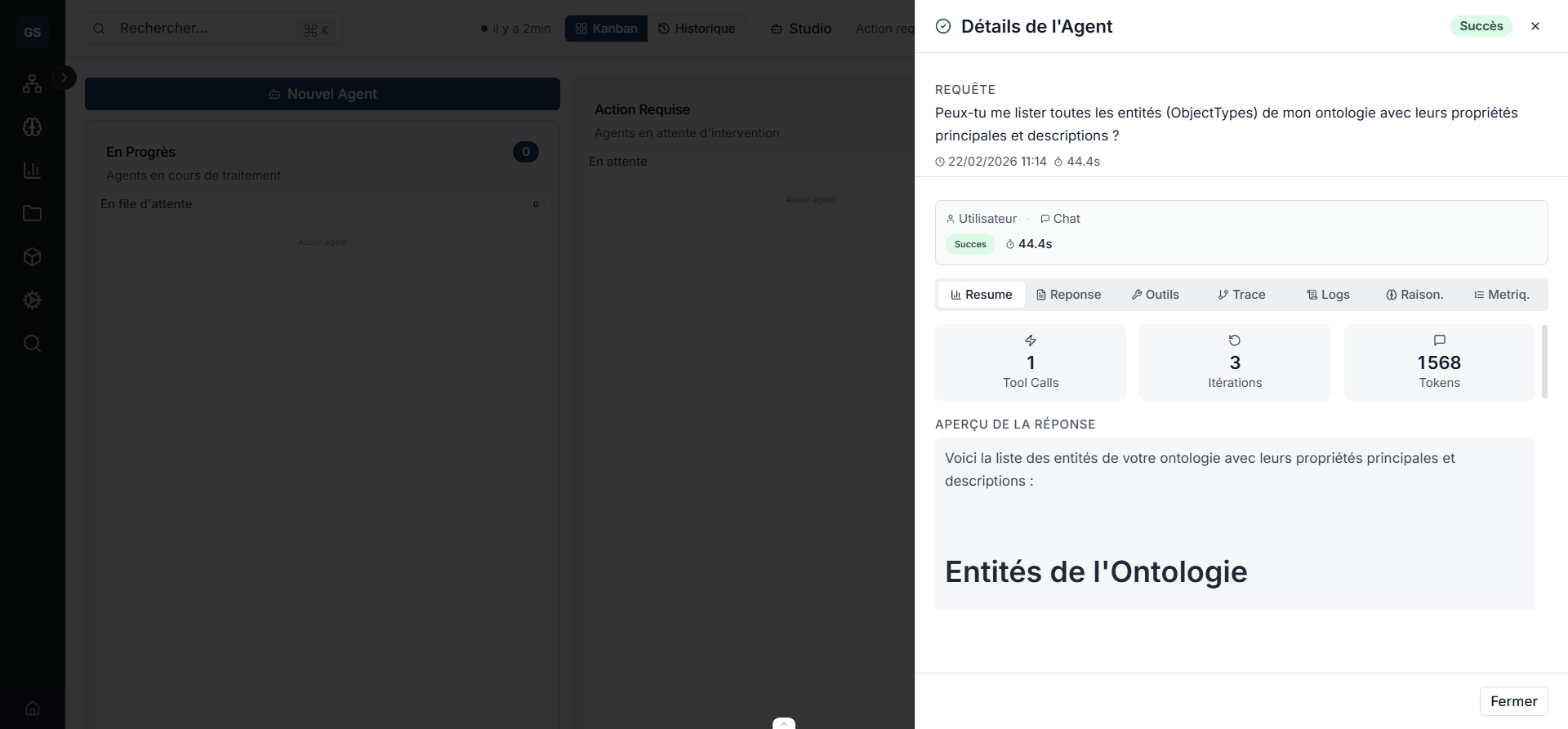
Execution history: for each execution, review the full detail: query, response, tools used, duration of each step, and any errors.
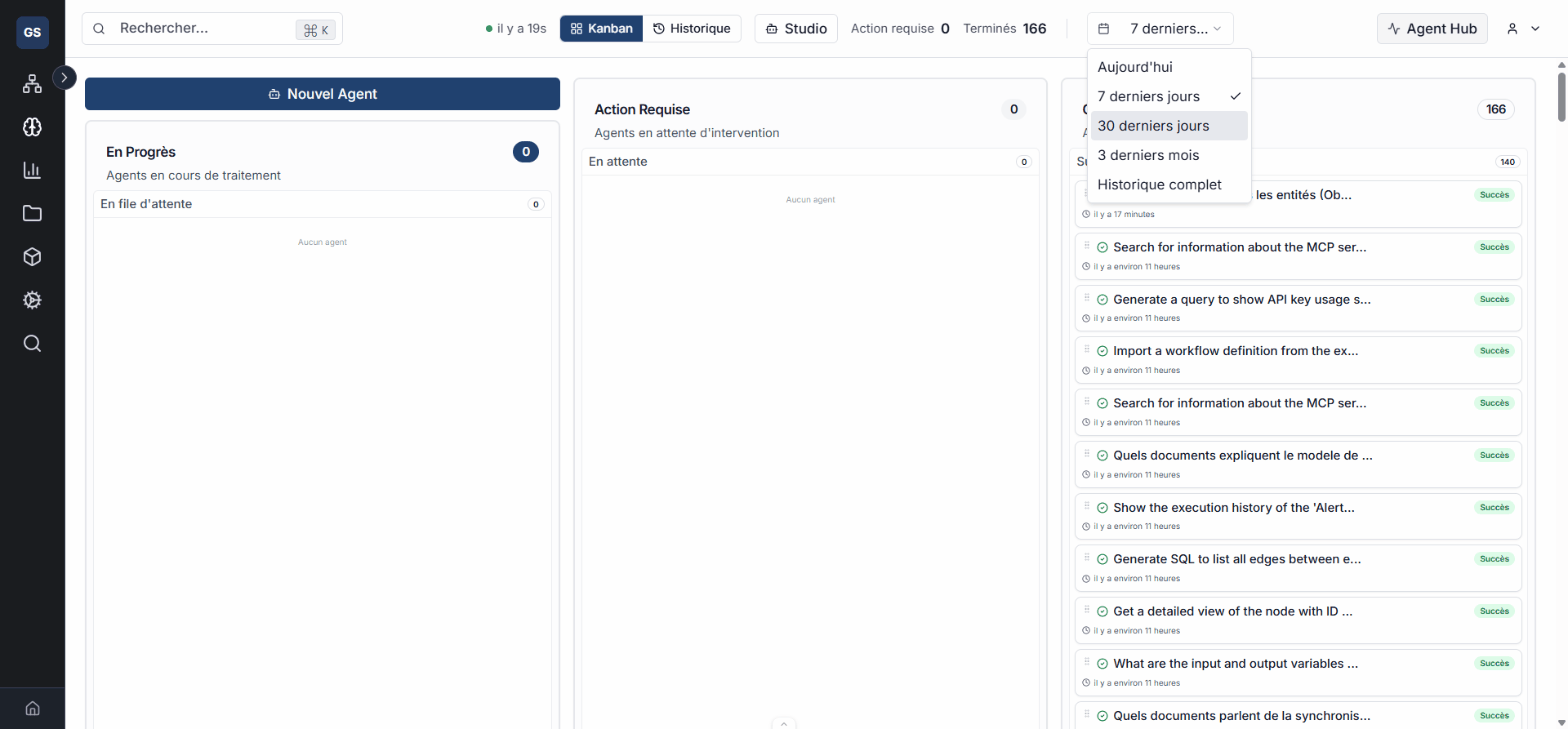
Filters and search: filter by date, status, agent, or search by query content.
Practical example: you notice that the success rate of your "Sales Assistant" agent has dropped from 95% to 82% this week. By reviewing the failed executions, you identify that an external endpoint changed its response format. You update the affected tool's configuration and the rate recovers.
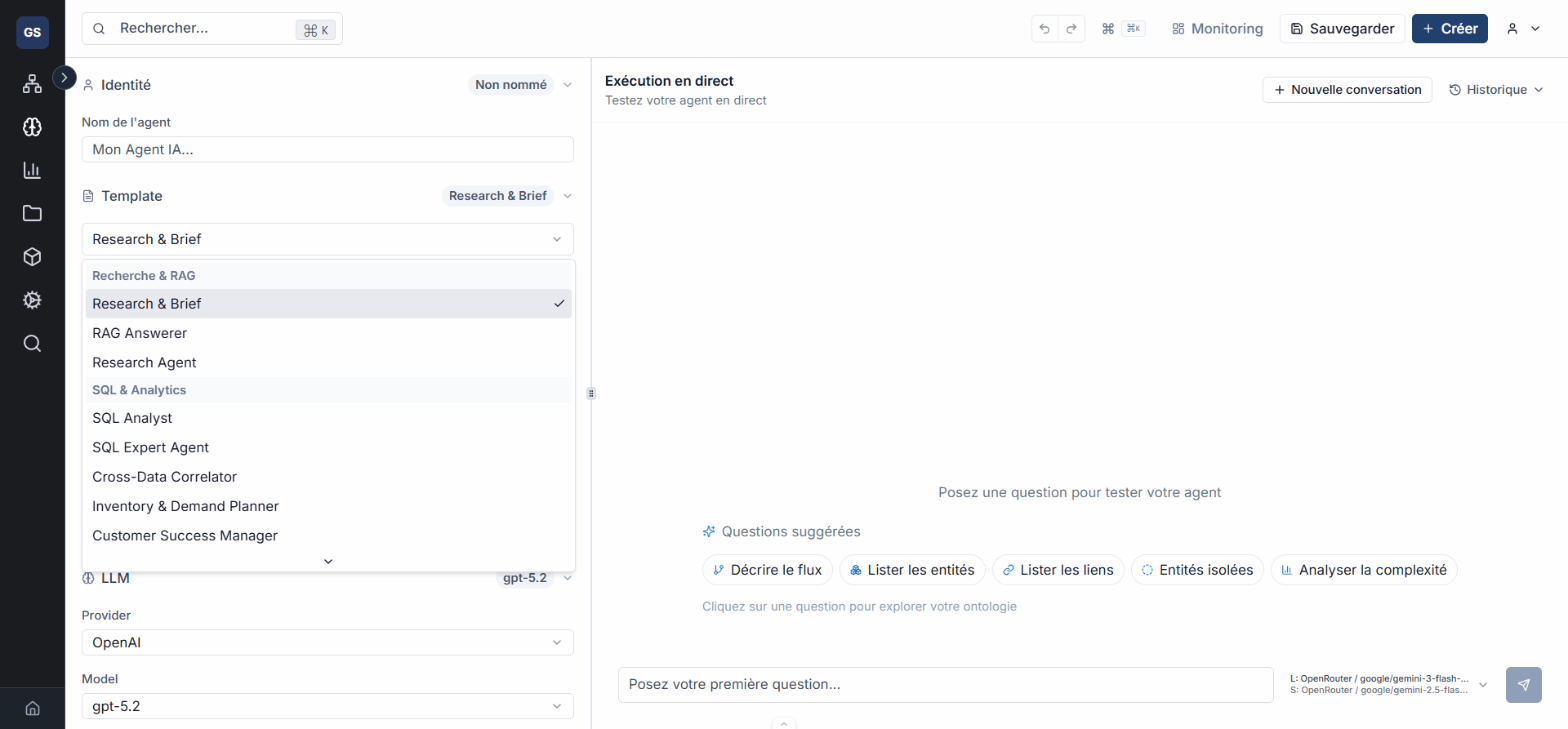
Enriched Template Gallery
The template gallery has been expanded to make agent creation easier:
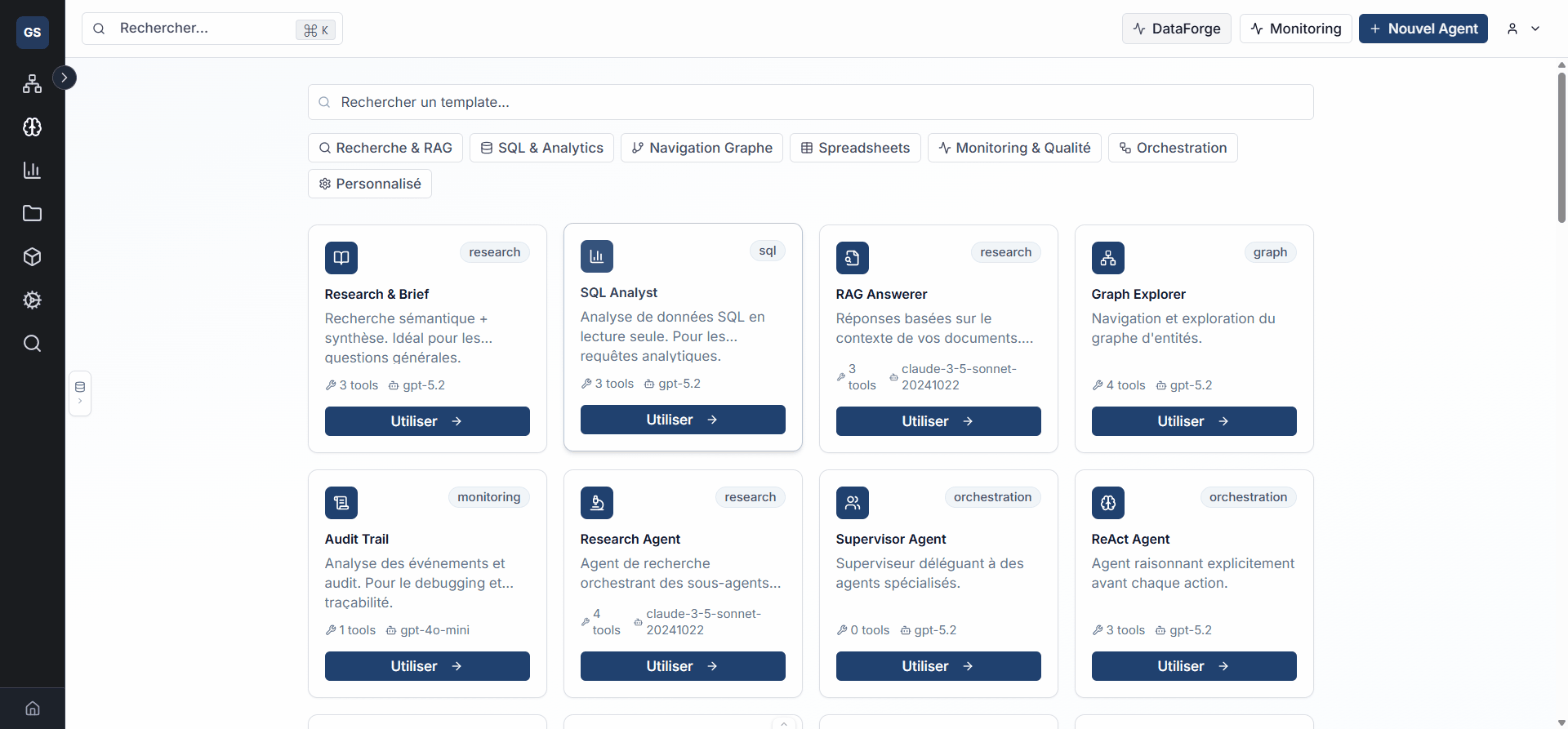
- Use-case templates: FAQ assistant, data analyst, triage agent, reporting agent.
- Industry templates: e-commerce, finance, human resources, logistics.
- Guided customization: each template includes explanations of which parameters to adjust.
Improved Navigation
Navigation in Agent Studio has been redesigned for quick access:
- Dedicated sidebar: direct access to the gallery, monitoring, and visualizer.
- Smooth transitions: switch from the monitoring Hub to the visualizer in a single click.
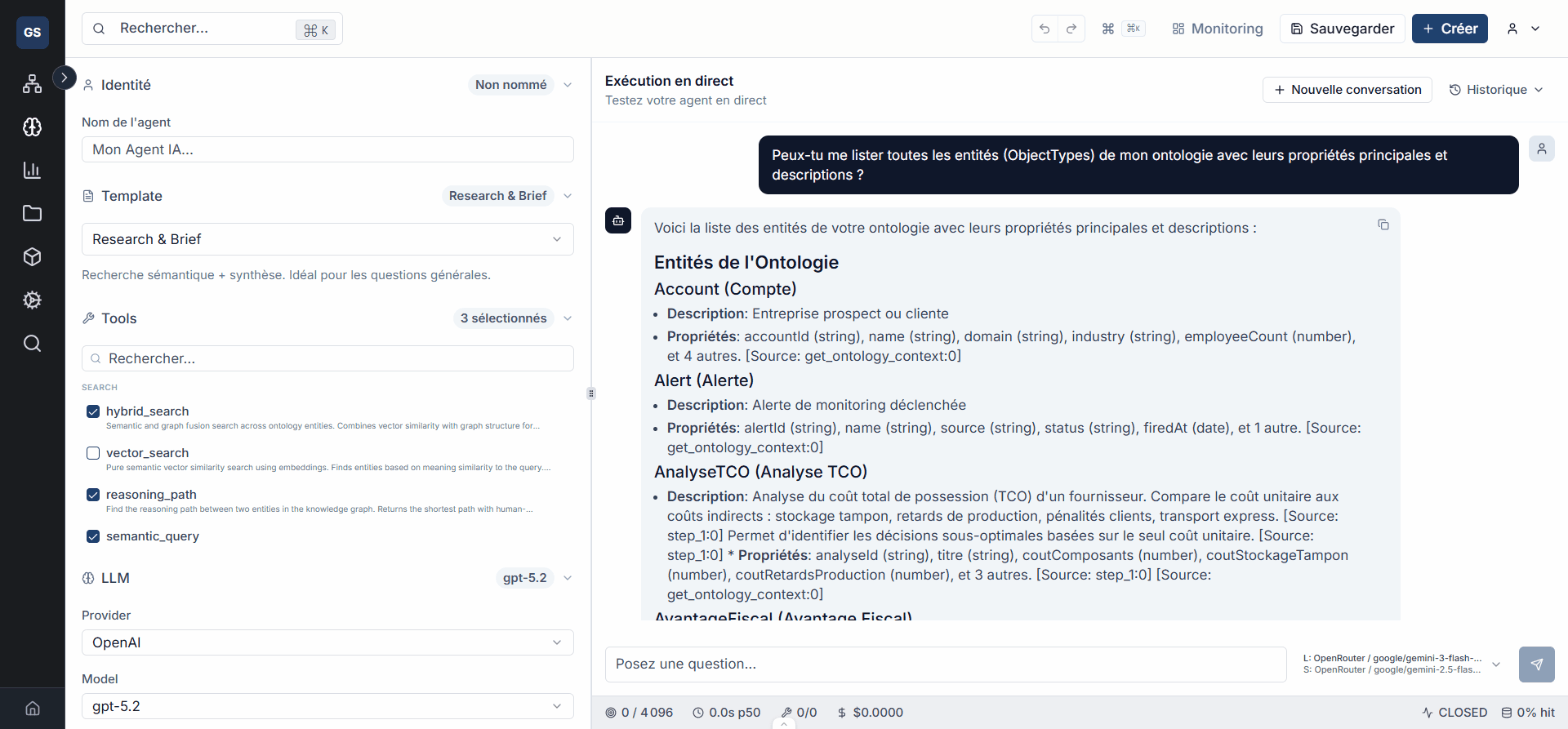
Getting Started
- Navigate to Agent Studio in the main menu.
- Create an agent from the gallery: choose a template or start from scratch.
- Configure tools: select the tools your agent can use.
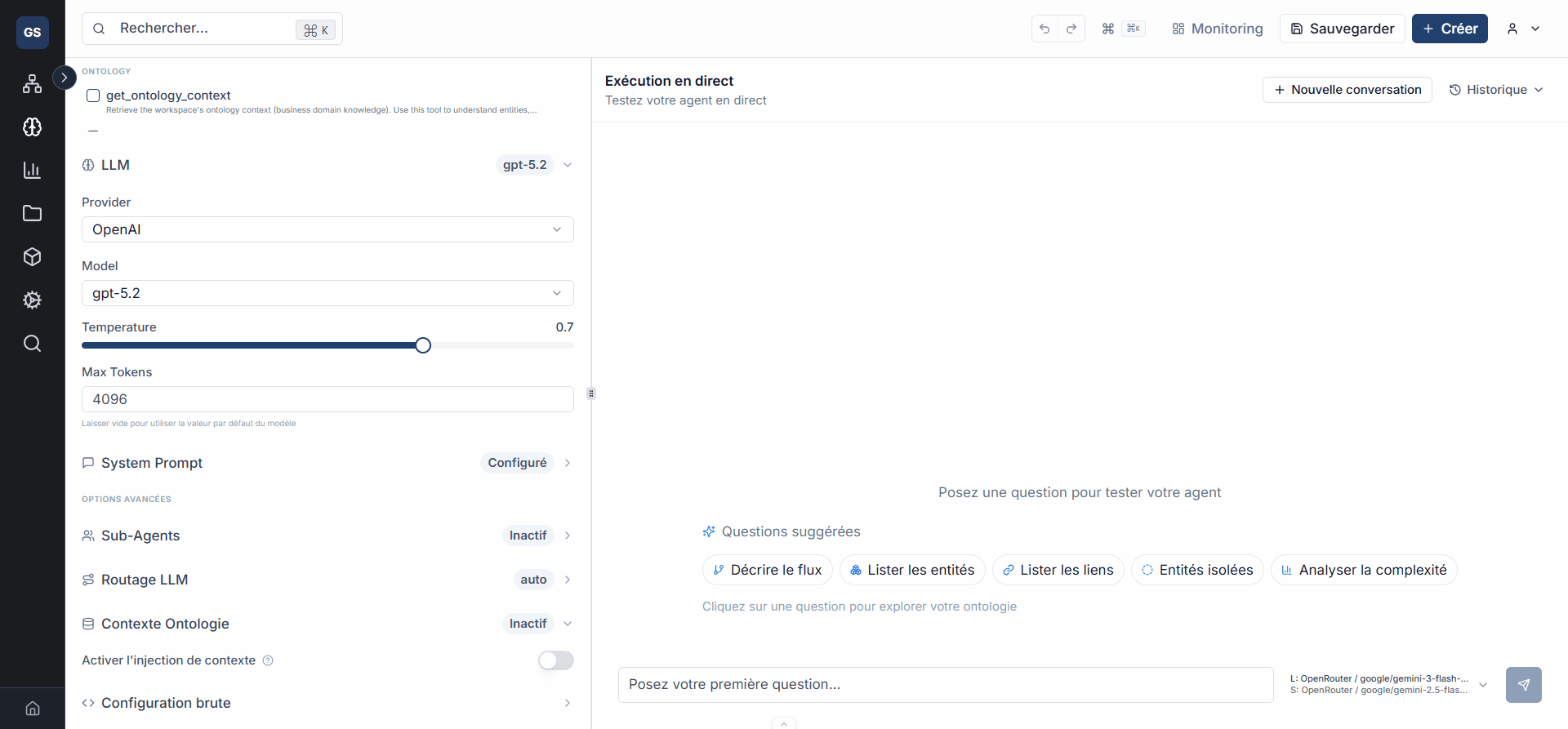
- Test in the editor with sample queries.
- Publish and track performance in the monitoring Hub.
- Debug with the OODA visualizer when behavior is unexpected.
Next Steps
- Agent Studio — Agent Studio overview
- Create an agent — Step-by-step creation guide
- Monitoring — Understanding the monitoring Hub
- OODA Visualizer — Visualizer guide
- Support — Need help with your agents?